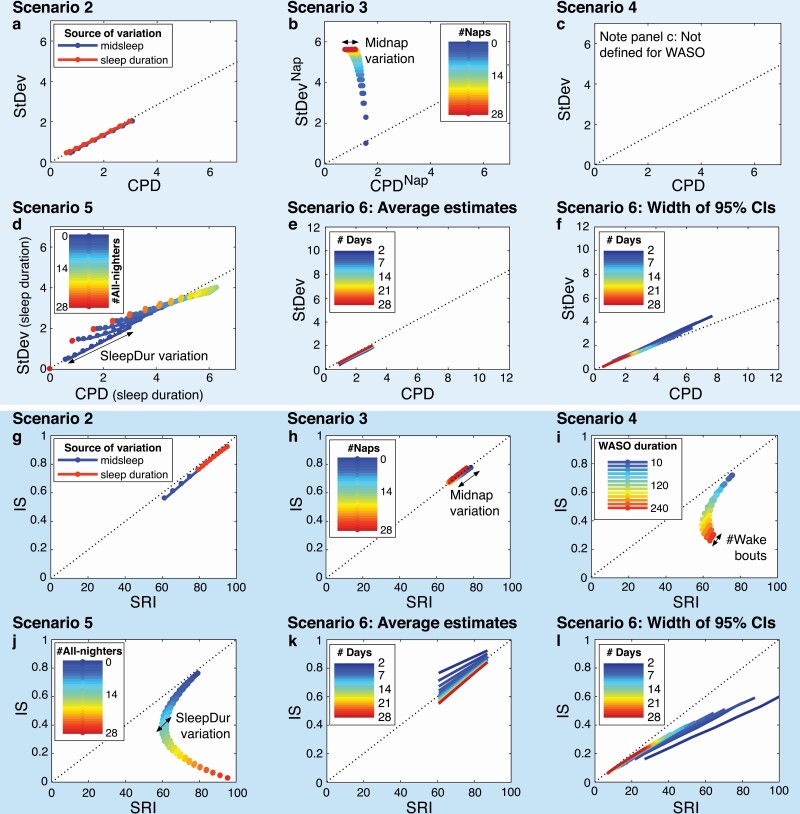
Figure 6.
Correspondence between sleep regularity metrics: StDev vs. CPD and IS vs. SRI. The upper six panels show values of StDev and CPD plotted against each other. The lower six panels show values of IS and SRI plotted against each other. Results are shown for Scenario 2 (A, G), Scenario 3 (naps) (B, H), Scenario 4 (awakenings) (C, I), Scenario 5 (all-nighters) (D, J), and Scenario 6 (study length) (C–F, K–L). Note that StDev and CPD cannot be calculated for sleep–wake patterns with awakenings, so panel C is empty. The dotted lines all have a zero-intercept but the slope equals 1 in the lower six panels (G–L) and 0.7/0.5 in the upper six panels (panels A–E/panel F), corresponding to the factors by which values of StDev are generally smaller than those of CPD. The colored lines in each panel represent the different levels in a given variable, for example, number of naps in panel B. The arrows represent the effect of varying a second variable, for example, in panel B the spread in points of the same color (for each number of naps) is due to variation in midnap timing.

