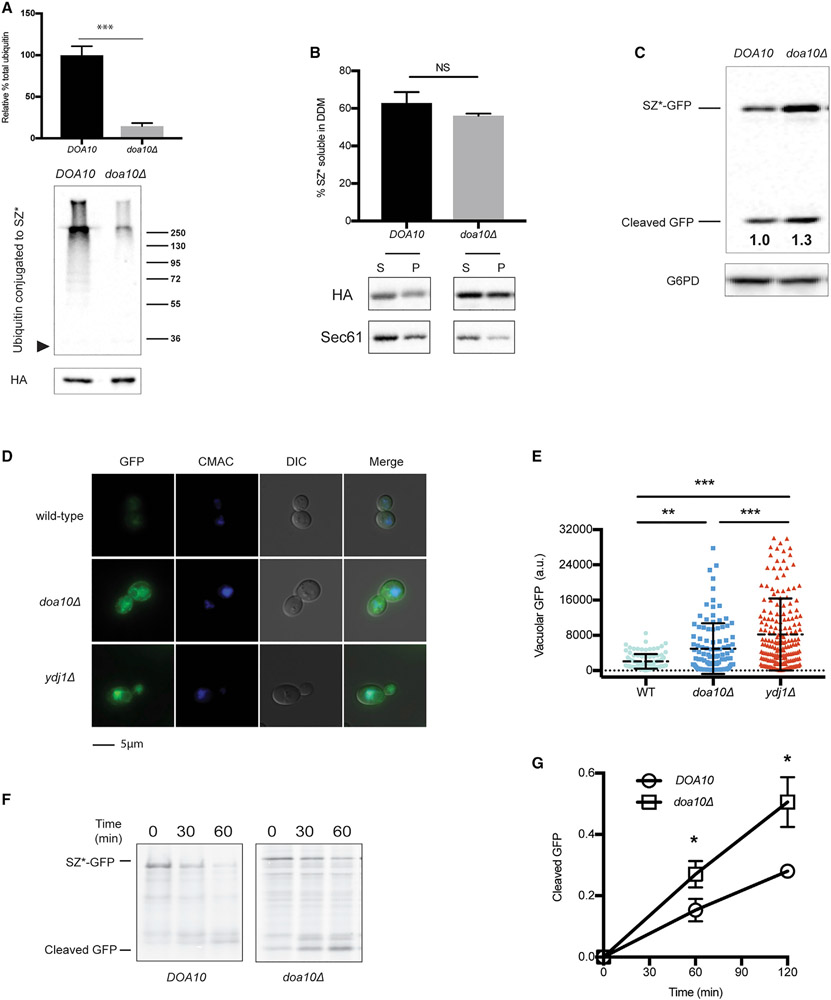
Figure 3. Disrupting SZ* ubiquitination facilitates ER exit.
(A) SZ* ubiquitination in wild-type and doa10Δ yeast was examined by immunoprecipitation of SZ* under denaturing conditions. The arrowhead to the left is the location at which SZ* migrates, and a molecular mass ladder (×103 Dalton) is shown to the right. Total SZ* (HA) is also depicted. Data are the means ± SE of 3 independent experiments; ***p < 0.0005.
(B) Microsomes from wild-type or doa10Δ yeast expressing SZ* were treated with 1% DDM. Protein in the supernatant (S) and pellet (P) fractions was analyzed after centrifugation and immunoblotting. Sec61 was blotted as a control. Data are the means ± SE of 3 independent experiments; NS, non-significant (p > 0.05).
(C) GFP cleavage was determined by immunoblotting in the presence or absence of Doa10. Numbers indicate average values of normalized free GFP from 5 independent experiments.
(D) Live-cell fluorescence and differential interference contrast (DIC) imaging of SZ*-GFP in wild-type, ydj1Δ, and doa10Δ yeast. CMAC marks the yeast vacuole.
(E) Quantification of the GFP signal in the vacuole from (D). Greater than 100 cells in each strain were counted; **p < 0.005, ***p < 0.0005; a.u., arbitrary units.
(F) GFP cleavage from SZ*-GFP was measured by pulse-chase in wild-type and doa10Δ yeast. Cleavage was determined as in Figure 2D.
(G) A graph depicting GFP cleavage rate of SZ*-GFP as quantified from (F). Data are the means ± SE of 3–4 independent experiments; *p < 0.05. Please note that DOA10 (wild-type) in this figure (F) is identical to YDJ1 (wild-type) in Figure 2D.

