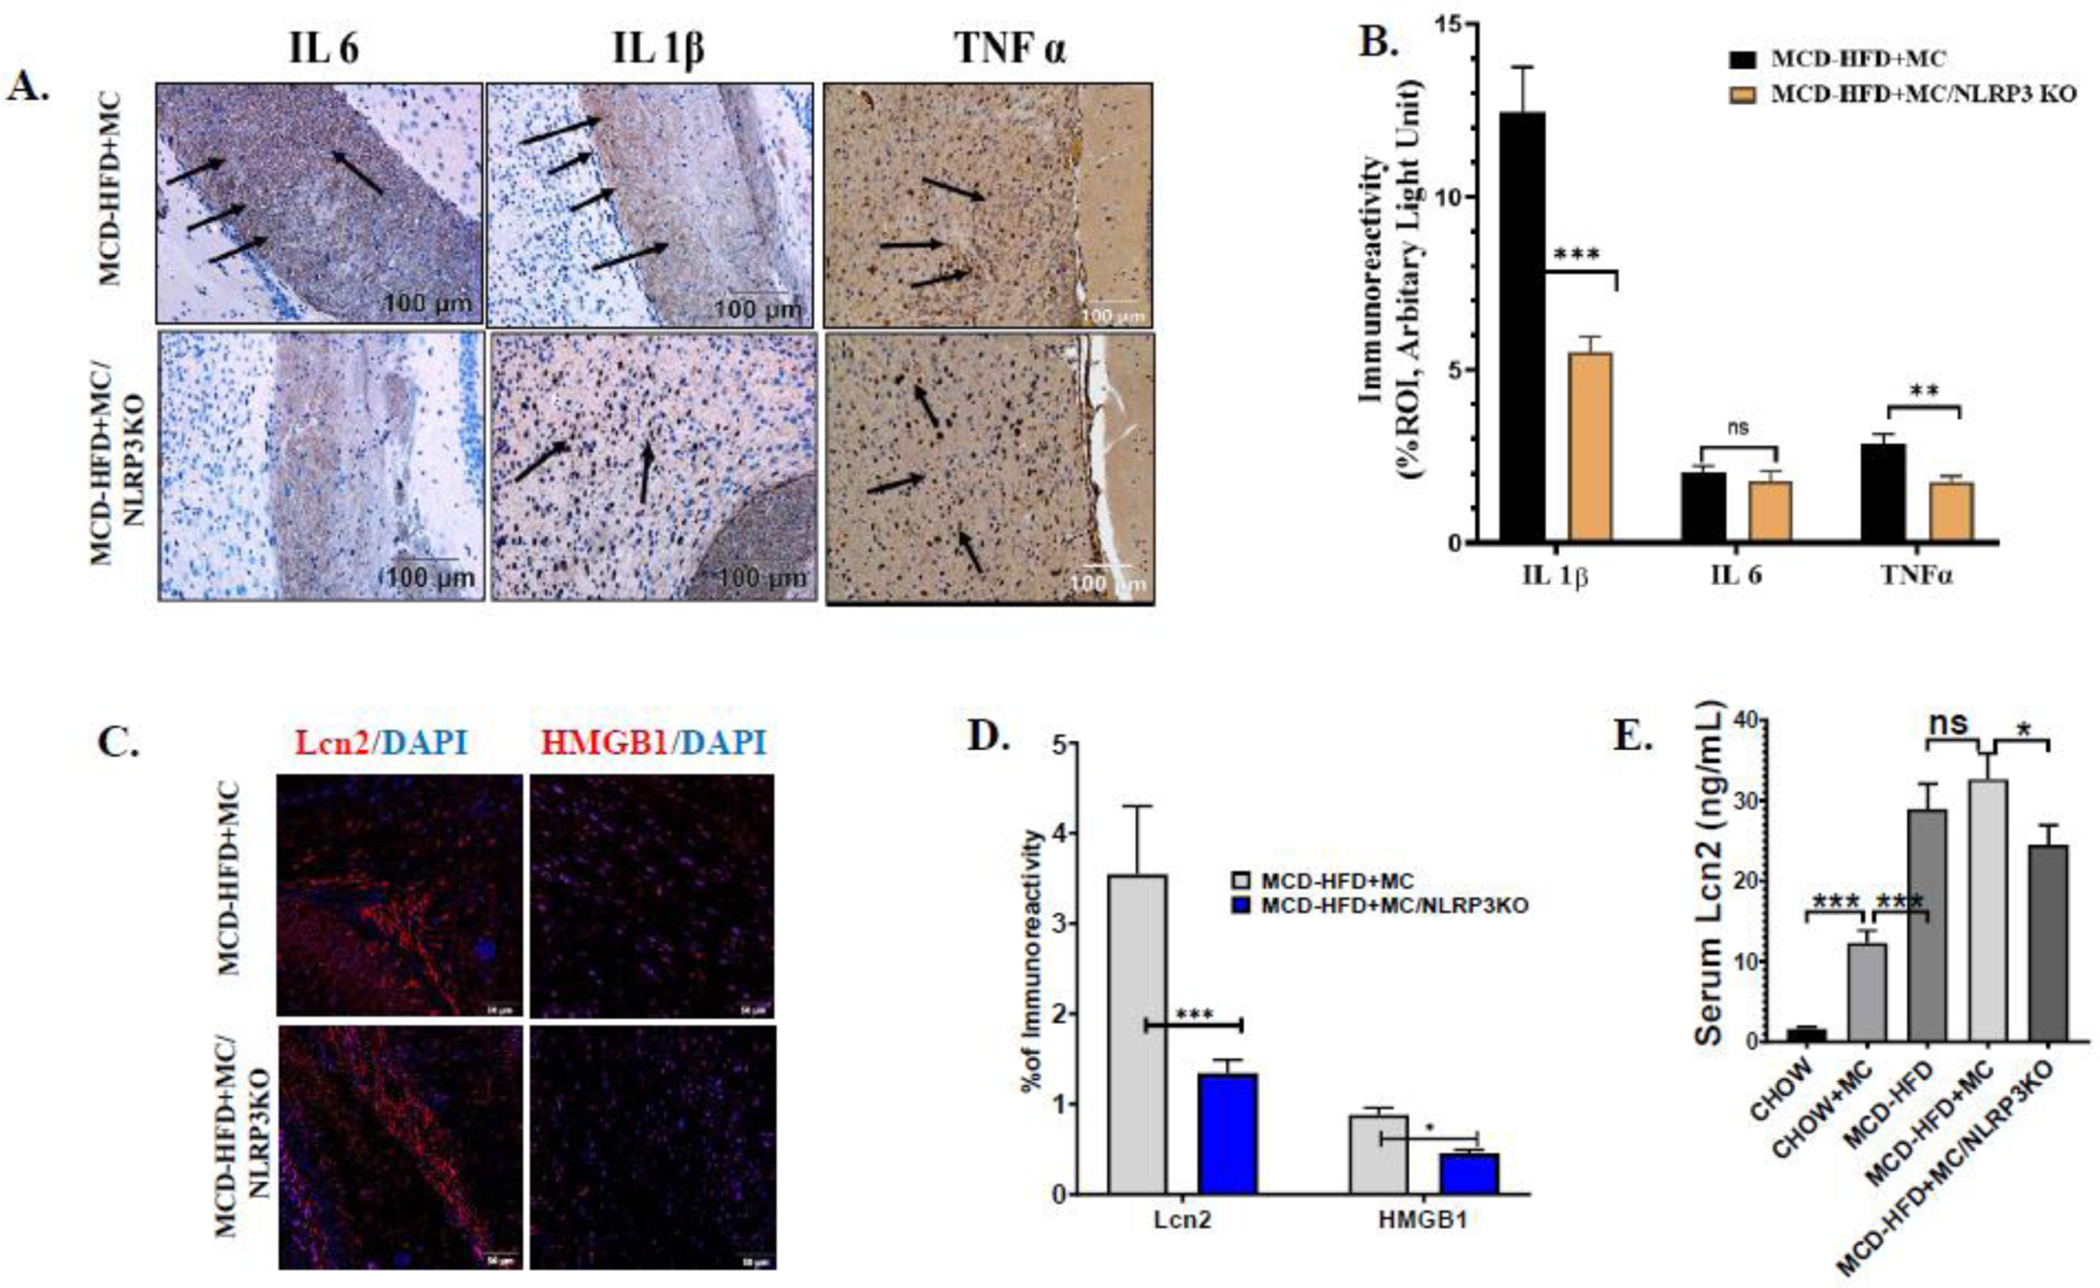
Fig. 2.

Pathological signs of MC-LR toxicity on WT, NAFLD/NASH mice brain are attenuated in NLRP3KO, NAFLD/NASH mice. (A.) Immunoreactivity of IL 1β, IL 6, and TNFα expression as depicted by immunohistochemistry images in brain sections of methionine choline-deficient and high-fat diet-fed, MC-LR exposed WT mice (MCD-HFD+MC) and NLRP3KO mice (MCD-HFD+MC/NLRP3KO). All images were taken at × 20 magnification (Scale: 100 μm) and immunoreactivity was indicated by black arrows. (B.) Morphometric analysis of IL 1β, IL 6, and TNFα immunoreactivity [mean data plotted on y-axis was measured as % positive immunoreactive area (% ROI) in arbitrary light units from three different microscopic fields] in MCD-HFD+MC and MCD-HFD+MC/NLRP3KO mice groups (**p< 0.01, ***p< 0.001, ns=non-significant). (C.) Immunoreactivity of Lcn2 (red) and HMGB1 (red) in brain sections counterstained with DAPI from MCD-HFD+MC and MCD-HFD+MC/NLRP3KO mice groups as shown by immunofluorescence microscopy. All images were taken at × 40 magnification (Scale: 50 μm) (D.) Morphometric analysis of HMGB1, and Lcn2 immunoreactivity [mean data plotted on y-axis was measured as % positive immunoreactive area (% ROI) in arbitrary light units from three different microscopic fields] in MCD-HFD+MC and MCD-HFD+MC/NLRP3KO mice groups (*p< 0.05, ***p< 0.001). (E.) Lcn2 level (ng/mL) was quantified by ELISA using serum from Chow, Chow+MC, MCD-HFD, MCD-HFD+MC, and MCD-HFD+MC/NLRP3KO mice groups and plotted as a bar graph (**p< 0.01, ***p< 0.001, ns=non-significant). All statistical significance was tested by performing unpaired t-test between the groups (*p< 0.05, **p< 0.01, ***p< 0.001, ns=non-significant), followed by Bonferroni Dunn Post hoc corrections.
