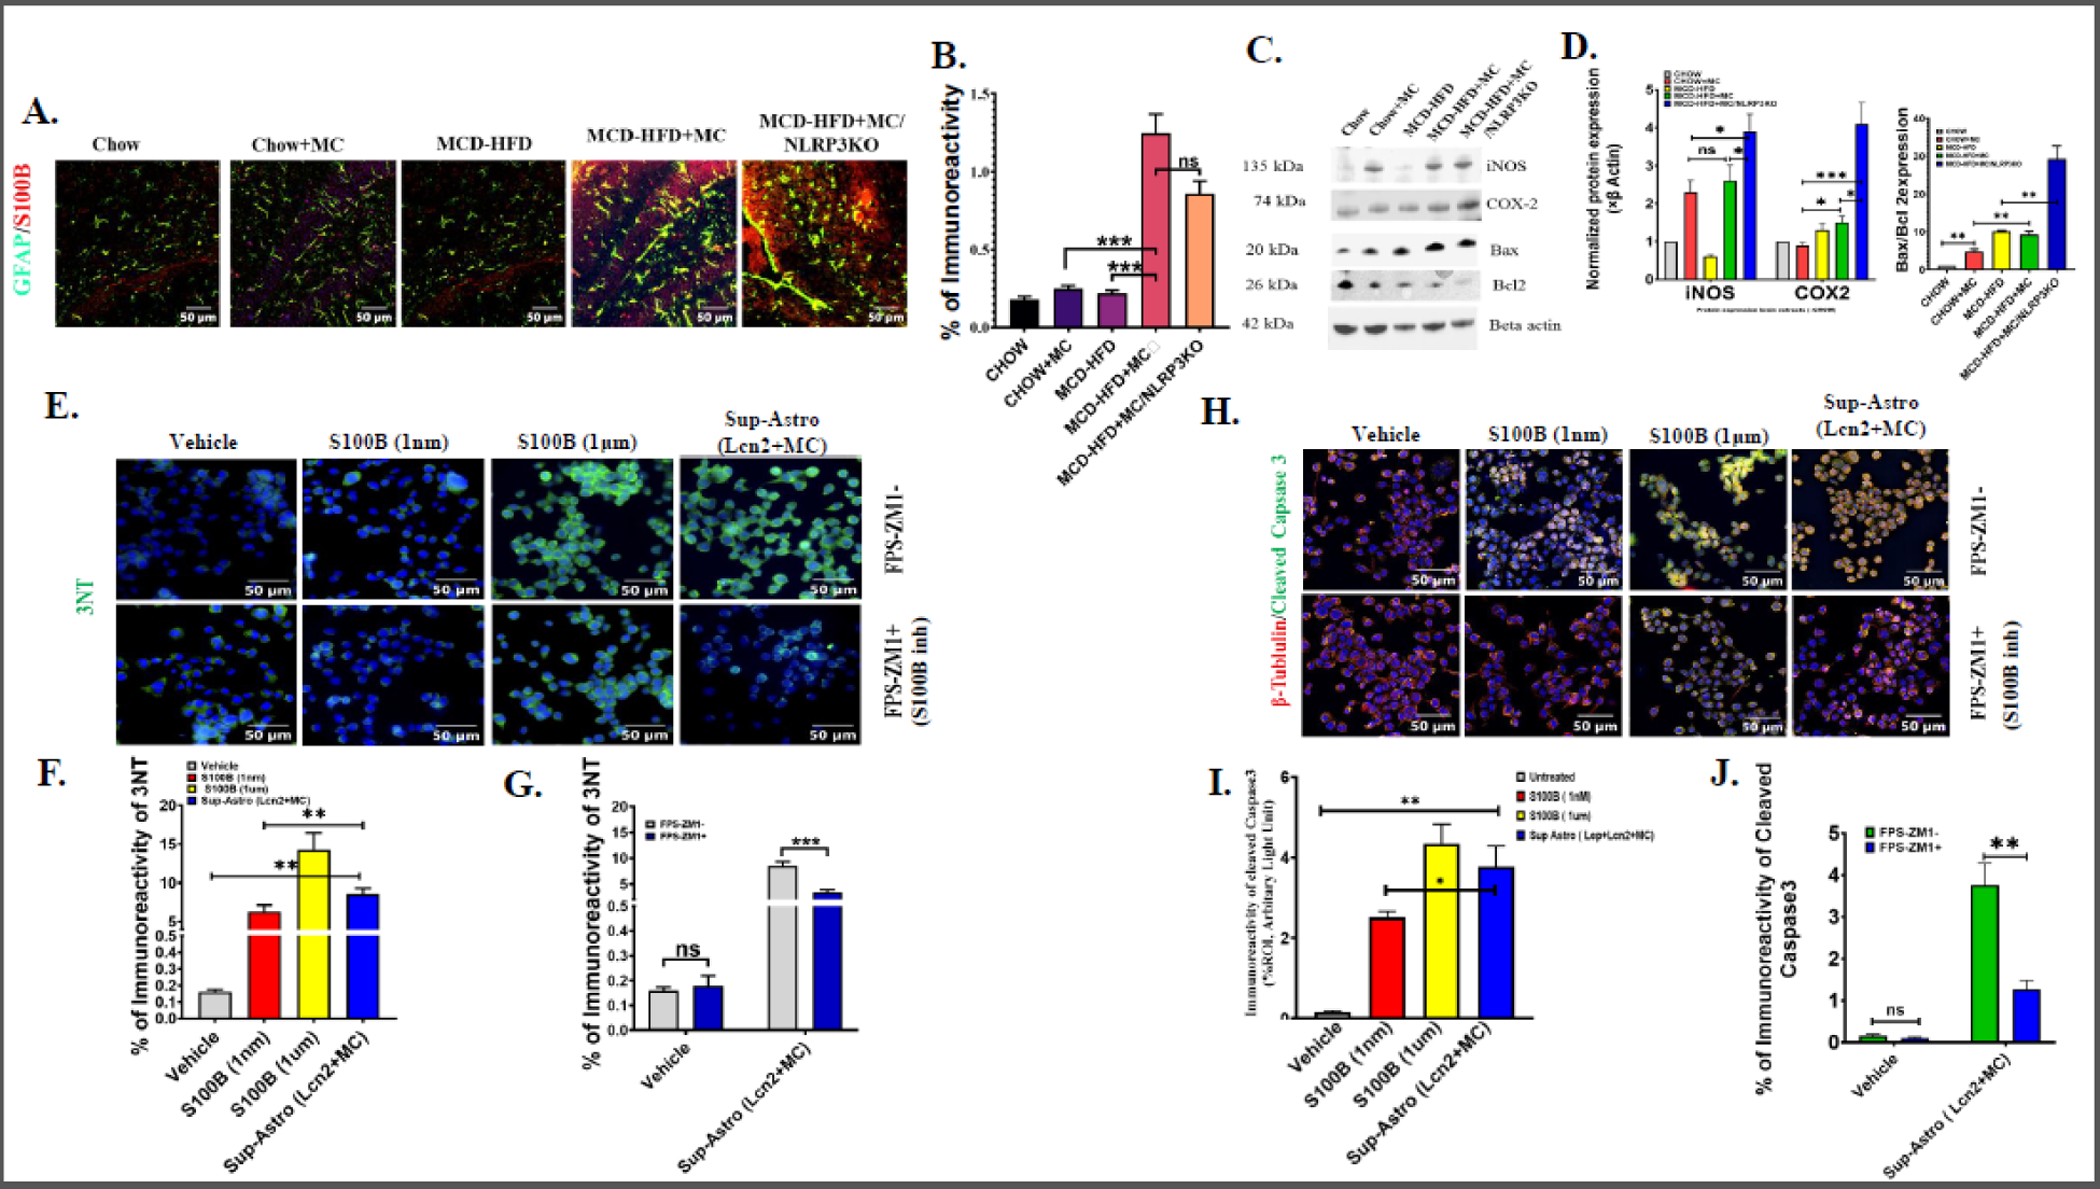
Fig. 4.

(A.) Colocalization events of GFAP (green) and S100B (red) immunoreactivity in brain sections from Chow, Chow+MC, MCD-HFD, MCD-HFD+MC, and MCD-HFD+MC/NLRP3KO mice groups as shown by immunofluorescence microscopy. Colocalization of GFAP and S100B was represented by yellow dots. All images were taken at × 40 magnification (Scale: 50 μm). (B.) Morphometric analysis of GFAP/S100B colocalization events [mean data plotted on y-axis was measured as % positive immunoreactive area (% ROI) in arbitrary light units from three different microscopic fields] in Chow, Chow+MC, MCD-HFD, MCD-HFD+MC, and MCD-HFD+MC/NLRP3KO mice groups (***p< 0.001, ns=non-significant). (C.) Western blot analysis of iNOS, COX-2, Bax, Bcl2 protein expression levels in Chow, Chow+MC, MCD-HFD, MCD-HFD+MC, and MCD-HFD+MC/NLRP3KO mice groups. Lanes 1–5 represent Chow, Chow+MC, MCD-HFD, MCD-HFD+MC, and MCD-HFD+MC/NLRP3KO mice groups, respectively. (D.) Band quantification of iNOS, COX-2 immunoblots normalized against β-actin and Bax immunoblot normalized against Bcl2 (*p< 0.05, **p< 0.01 ***p< 0.001, ns=non-significant). (E.) Immunoreactivity of 3-nitrotyrosine (3NT) (green) counterstained with DAPI in Neuro-2a cells exposed without or with FPS-ZM1 (S100B inhibitor) and treated with Vehicle, 1nM S100B, 1 μM S100B, and Astrocyte cell culture supernatant (MC+Lcn2) separately. All images were taken at × 40 magnification (Scale: 50 μm). (F.) Morphometric analysis of 3NT immunoreactivity [mean data plotted on y-axis was measured as % positive immunoreactive area (% ROI) in arbitrary light units from three different microscopic fields] in Neuro-2a cells treated with Vehicle, 1nM S100B, 1 μM S100B, and Astrocyte culture Sup (MC+Lcn2) separately (**p< 0.01, ns=non-significant) (G.) Comparative analysis of 3NT immunoreactivity, in Neuro-2a cells, exposed with Astroctye culture Sup (MC+Lcn2) or with Vehicle (Control) in presence of S100B inhibitor FPS-ZM1, or in its absence (***p< 0.001, ns=non-significant). (H.) Colocalization events of β-tubulin (red) and Cleaved Caspase3 (green) immunoreactivity counterstained with DAPI in Neuro-2a cells exposed without or with FPS-ZM1 and treated with vehicle (Control), 1nM S100B, 1 μM S100B, and Cell culture Sup (MC+Lcn2) separately. All images were taken at × 40 magnification (Scale: 50 μm). (I.) Morphometric analysis of β-tubulin and Cleaved Caspase3 colocalization events [mean data plotted on y-axis was measured as % positive immunoreactive area (% ROI) in arbitrary light units from three different microscopic fields] in Neuro-2a cells treated with vehicle (Control), 1nM S100B, 1 μM S100B, and Astrocyte culture Sup (MC +Lcn2) separately (*p< 0.05, **p< 0.01, ***p<0.001, ns=non-significant). All statistical significance was tested by performing unpaired t-test between the groups (*p< 0.05, **p< 0.01, ***p< 0.001, ns=non-significant), followed by Bonferroni Dunn Post hoc corrections. (J) Comparative analysis of Cleaved caspas3 and β-tubulin colocalization in Neuro-2a cells, exposed with Astroctye culture Sup (MC+Lcn2) or with Vehicle (Control) in presence of S100B inhibitor FPS-ZM1, or in its absence (**p< 0.01, ns=non-significant).
