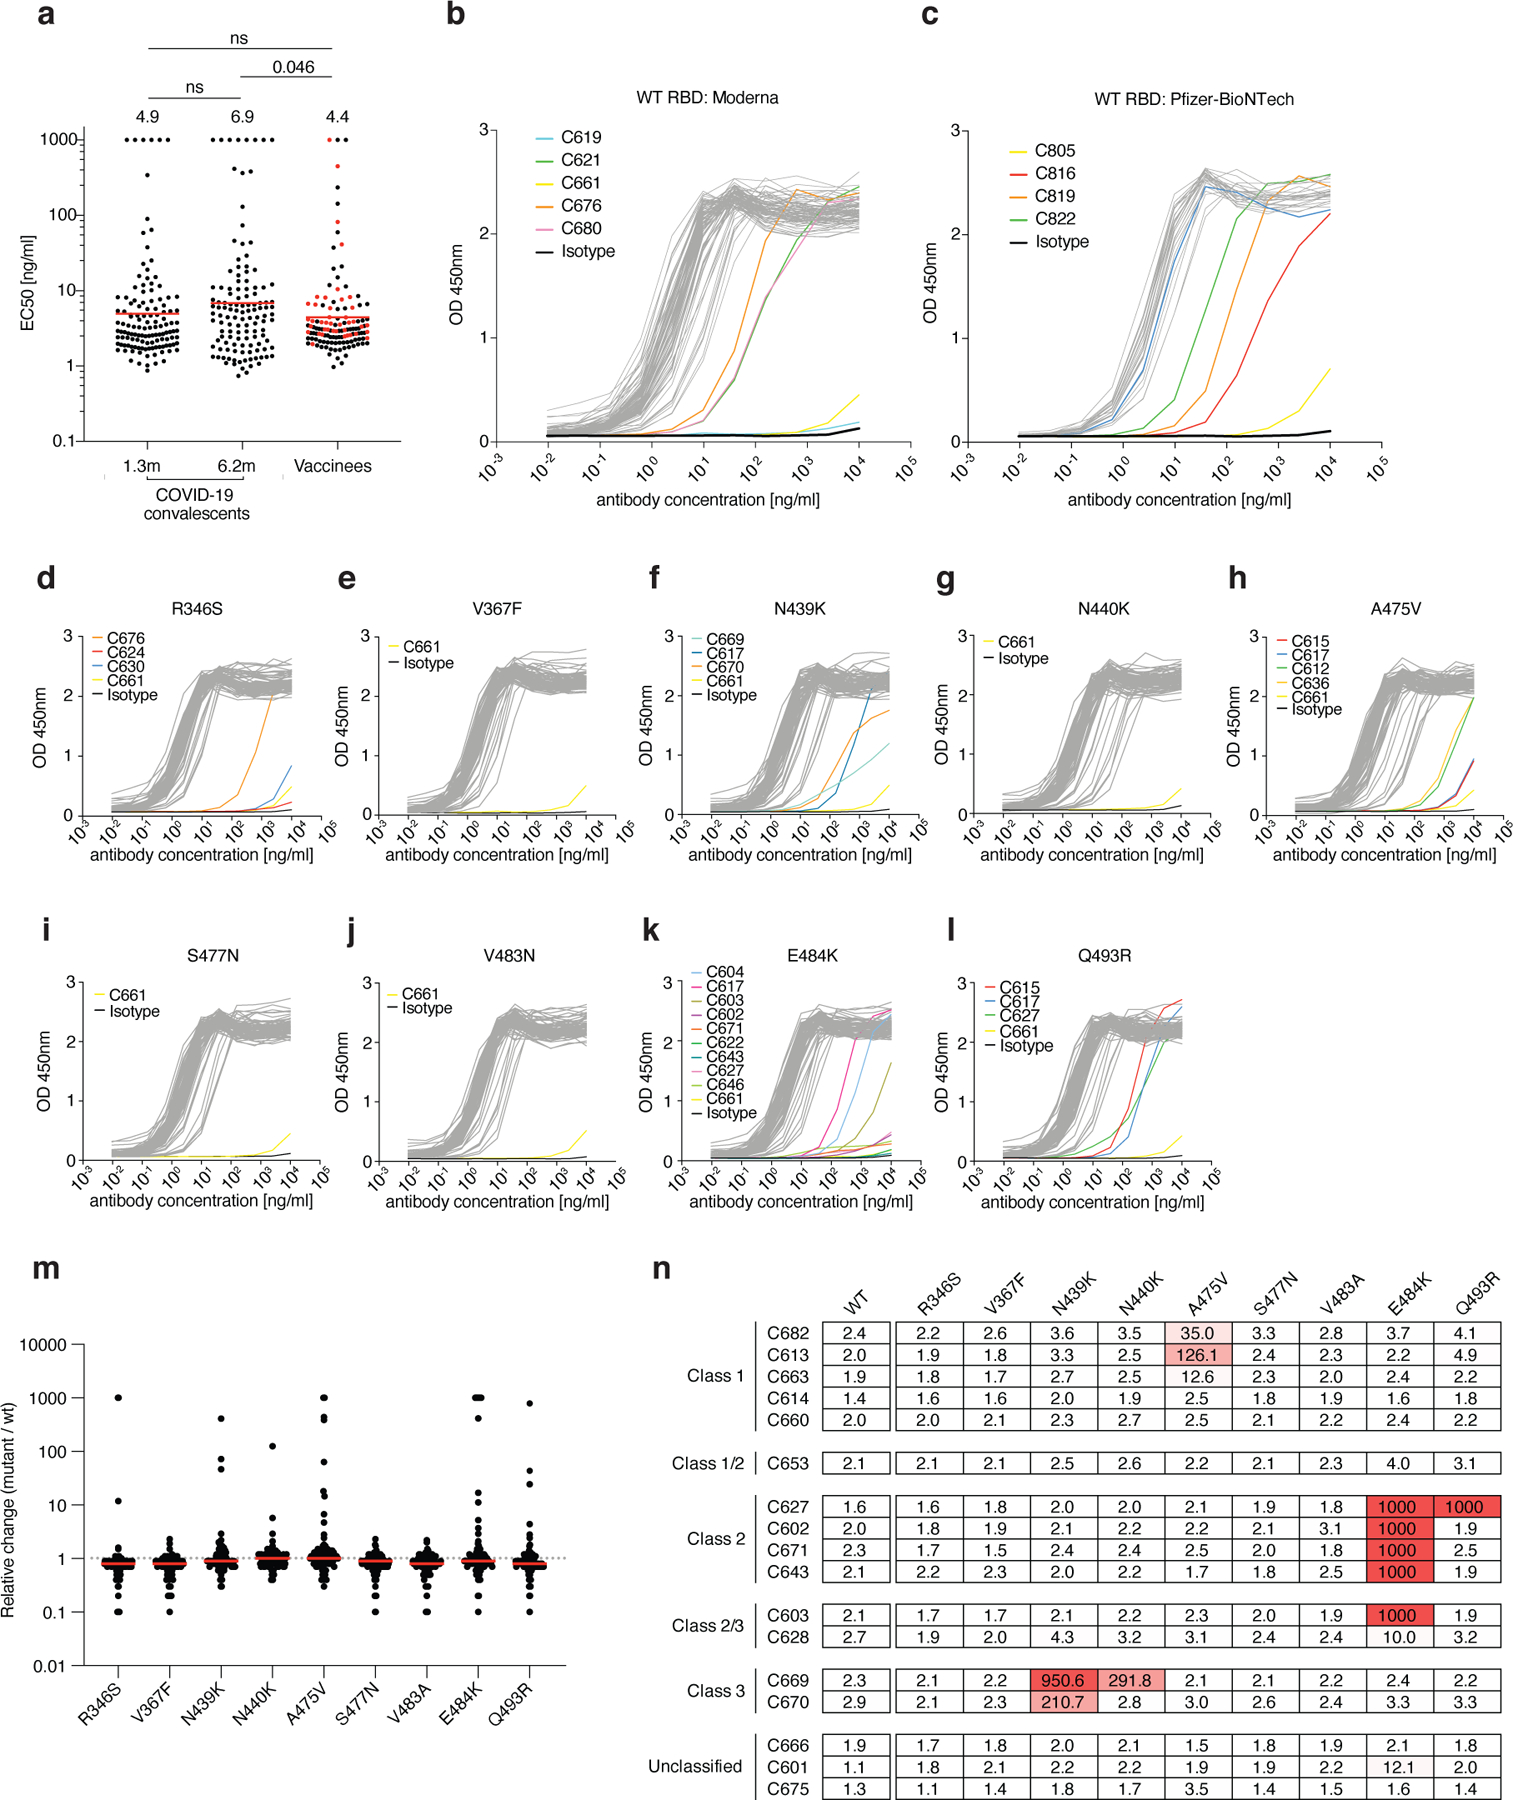
Extended Data Fig. 6: Monoclonal antibody ELISAs.

a, Graphs show anti-SARS-CoV-2 RBD antibody reactivity. ELISA EC50 values for all antibodies isolated from COVID-19 convalescent individuals assayed at 1.3 and 6.2 months after infection7,8 and 127 selected monoclonal antibodies isolated from 4 Moderna vaccinees (black dots) and 4 Pfizer-BioNTech vaccinees (red dots) measured at 8 weeks after the boost. Red horizontal bars and indicated values represent geometric mean. Statistical significance was determined using two-tailed Mann–Whitney U-test. b–c, Graphs show ELISA titration curves for 86 monoclonal antibodies isolated from Moderna vaccinees (b) and 41 monoclonal antibodies isolated from Pfizer-BioNTech vaccinees (c). d–l, Graphs show ELISA titrations for 84 antibodies isolated from Moderna vaccinees against the indicated RBD variants. Isotype control and low-binding antibodies are indicated in colors. C661 is a non-binding antibody. Data are representative of two independent experiments. m, Relative change in EC50 values for the indicated RBD variants over wt RBD of 84 antibodies isolated from Moderna vaccinees. Red horizontal bars represent geometric mean. n, a heat map summary of EC50 values for binding to wild type RBD and the indicated mutant RBDs for 17 top neutralizing antibodies.
