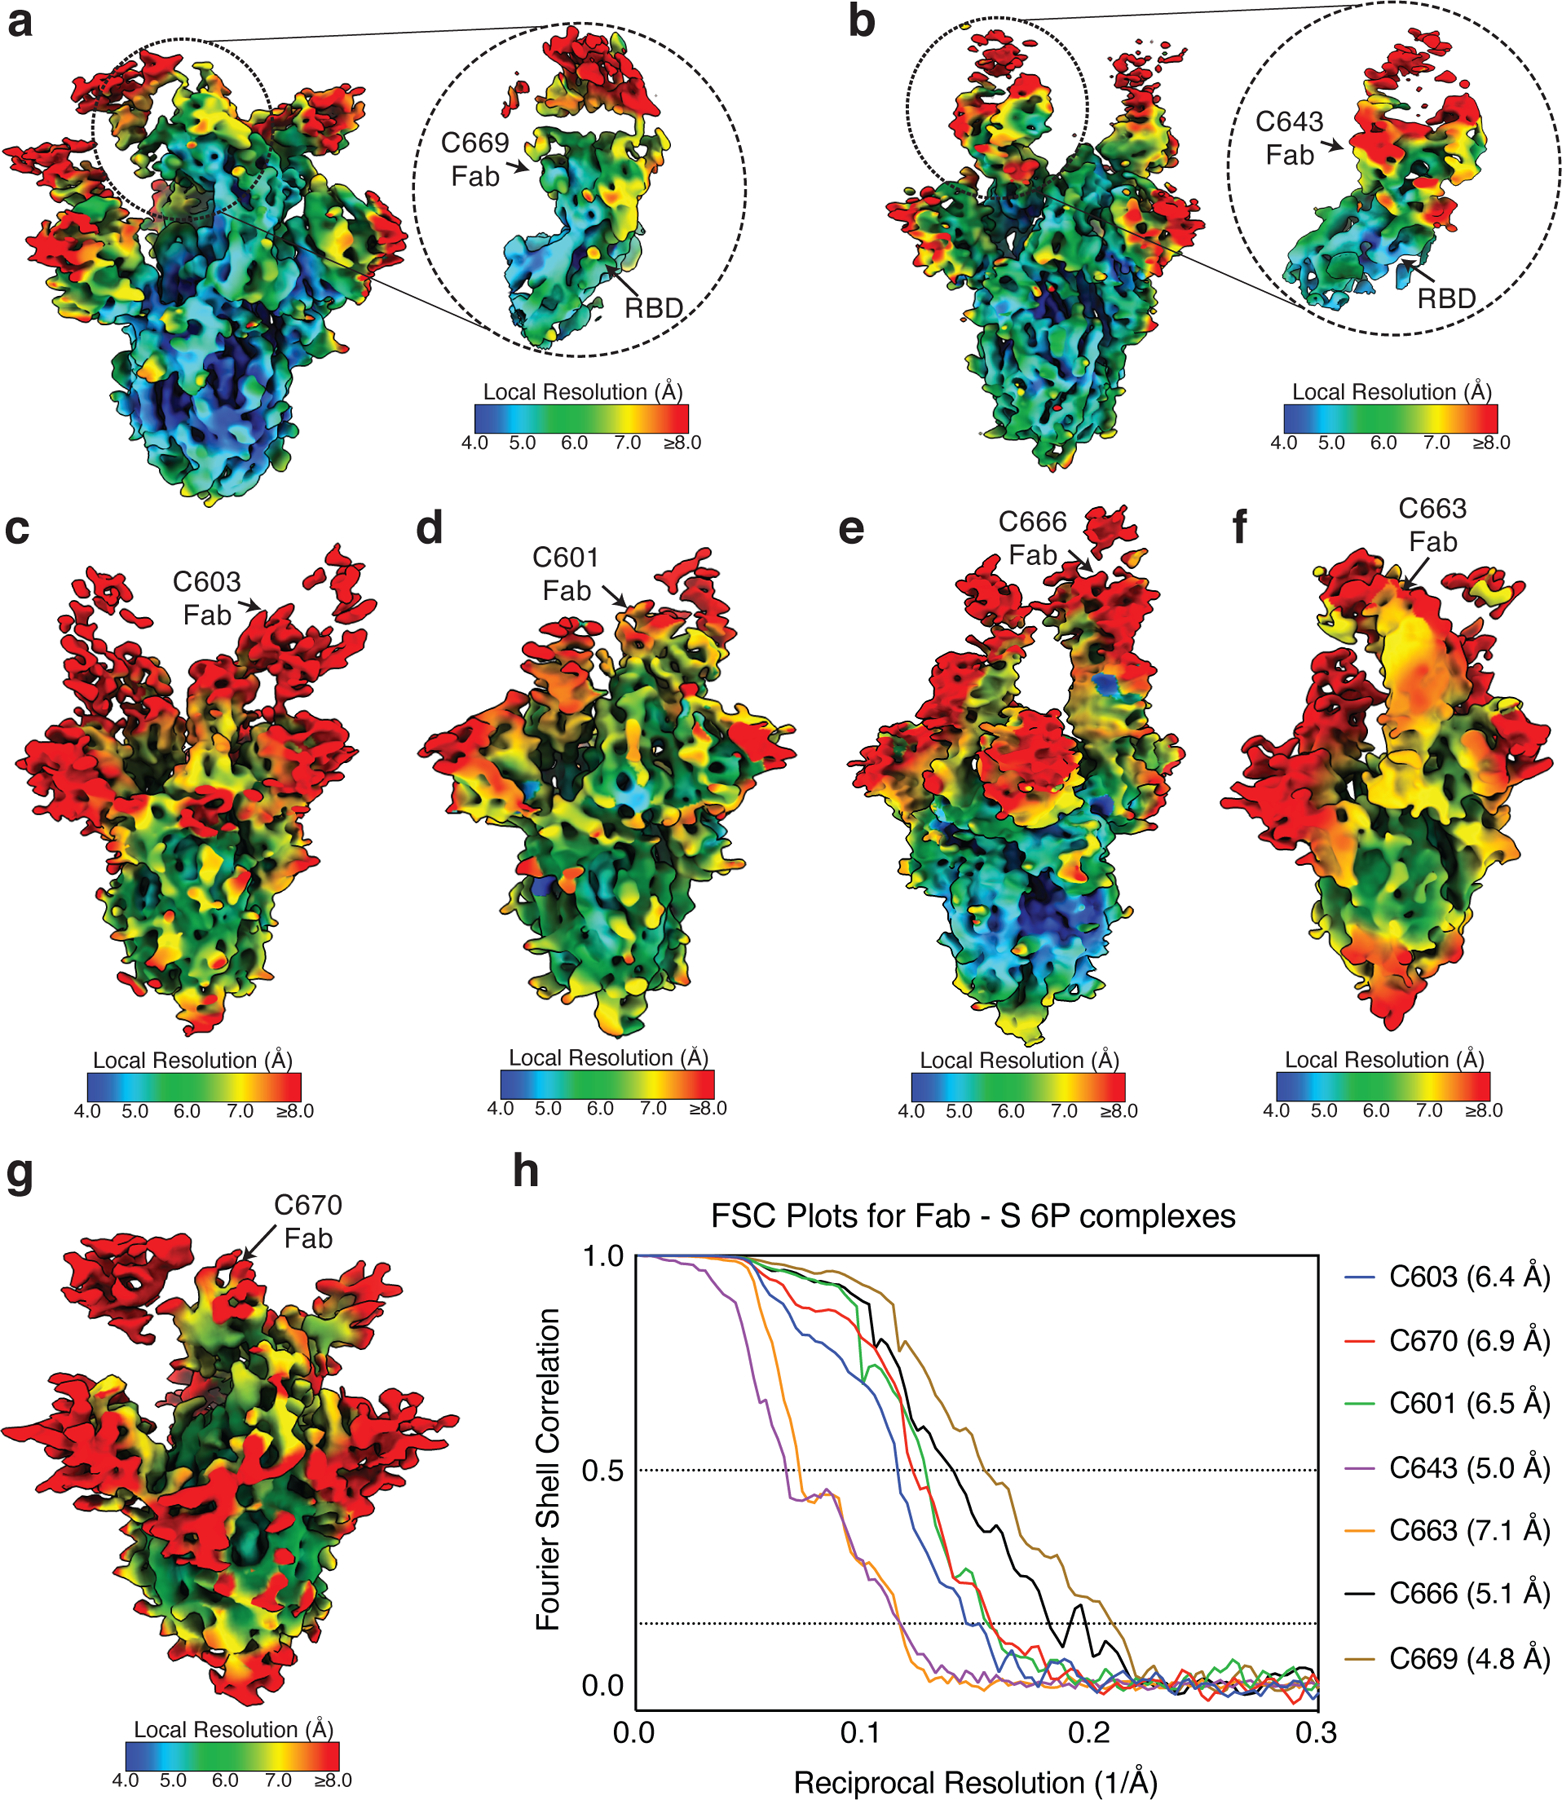
Extended Data Fig. 8: Local resolution estimates of Fab-S cryo-EM reconstructions.

a–g, Local resolution maps calculated using cryoSPARC for (a) C669-S, (b) C643-S, (c) C603-S, (d) C601-S, (e) C666-S, (f) C663-S, and (g) C670-S complexes. Close-up views for Fab-RBD interfaces are highlighted for (a) C669 and (b) C643. h, Gold-standard Fourier shell correlation curves for Fab-S complexes. The 0.5 and 0.143 cutoffs are indicated by dashed lines.
