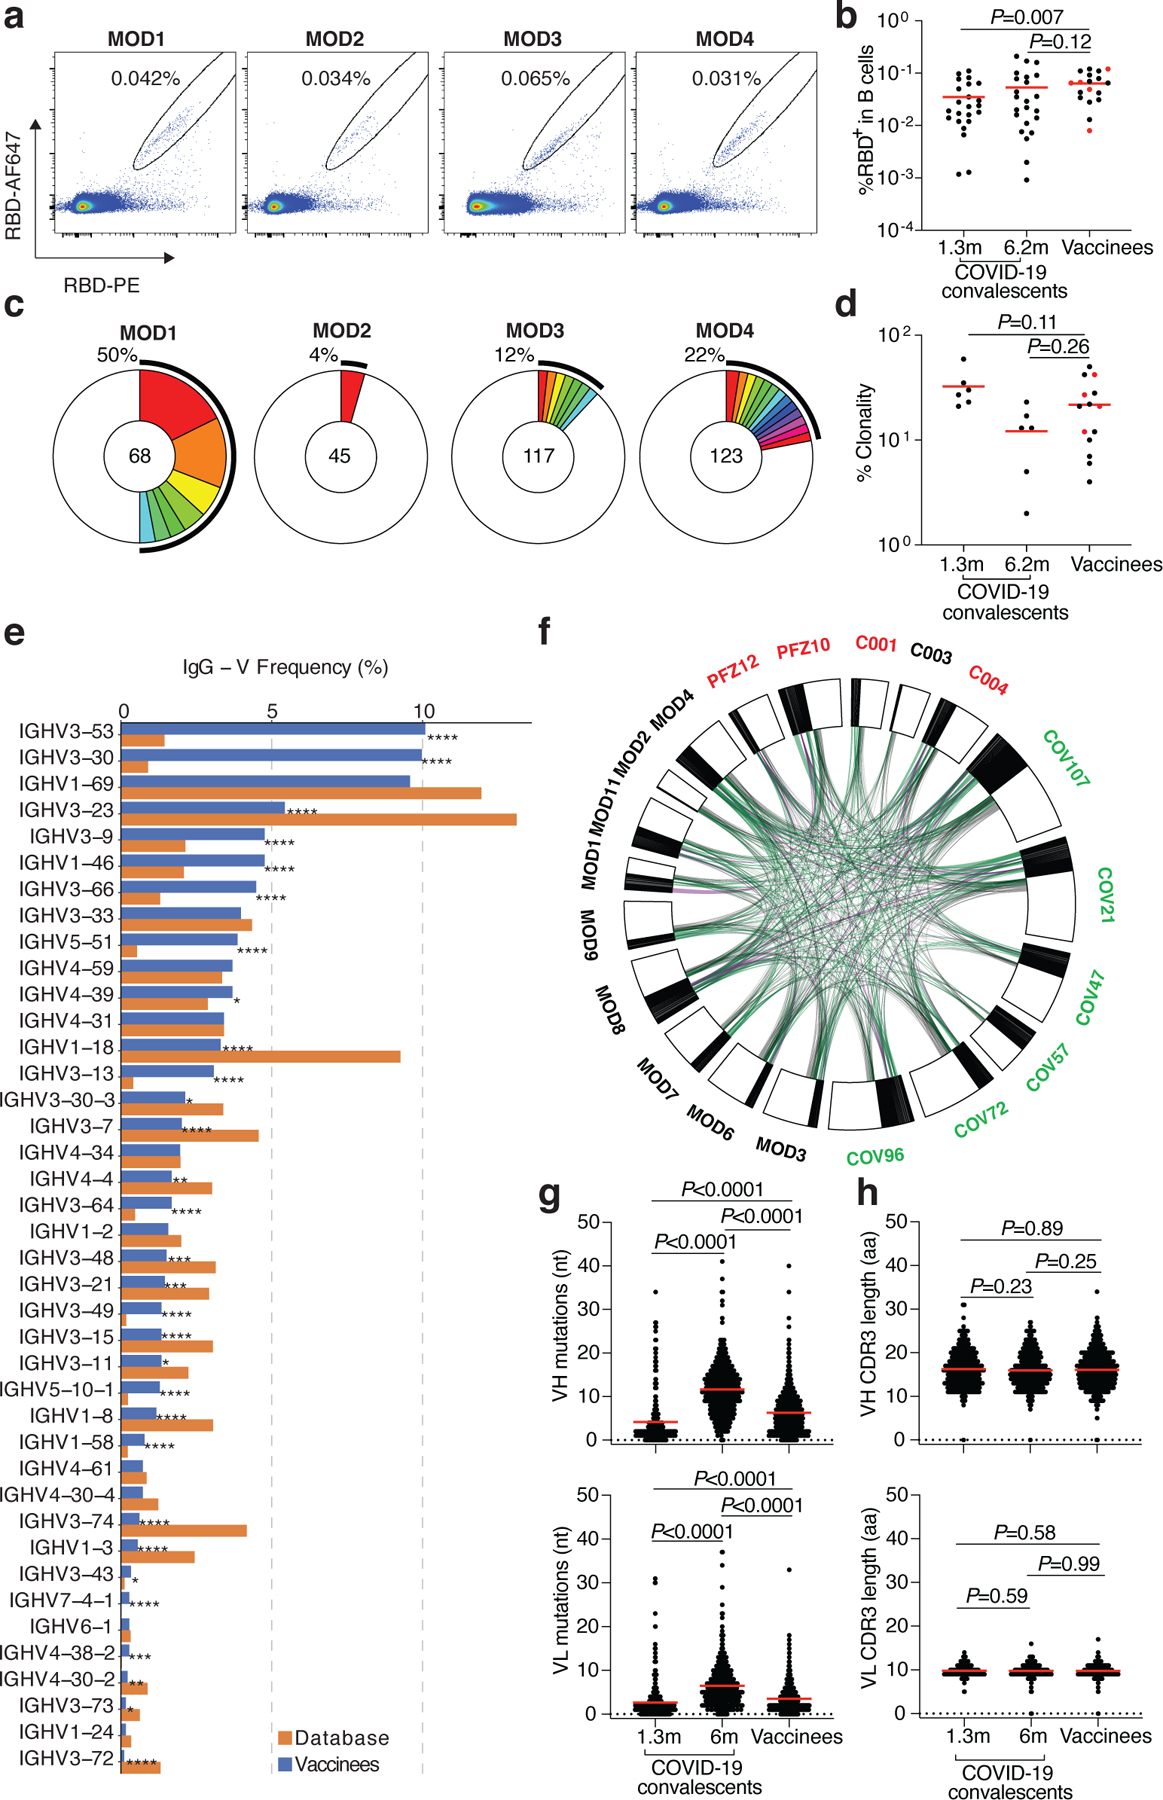
Fig. 2. Memory B cell antibodies.

a, Representative flow cytometry plots showing dual AlexaFluor-647-RBD and PE-RBD binding B cells for 4 vaccinees. b, as in a, dot plot summarizes the percentage of RBD binding B cells in 19 vaccinees, in comparison to a cohort of infected individuals assayed 1.3 and 6.2 months after infection7,8. Individuals who received the Moderna vaccine are shown in black and Pfizer-BioNTech vaccine recipients in red. Red horizontal bars indicate mean values. Statistical significance was determined using two-tailed Mann–Whitney U-tests. c, Pie charts show the distribution of antibody sequences from the 4 individuals in a. The number in the inner circle indicates the number of sequences analyzed. Pie slice size is proportional to the number of clonally related sequences. The black outline indicates the frequency of clonally expanded sequences. d, as in c, graph shows relative clonality among 14 vaccinees assayed, individuals who received the Moderna vaccine are shown in black and Pfizer-BioNTech vaccine recipients in red. Red horizontal bars indicate mean values. Statistical significance was determined using two-tailed Mann–Whitney U-tests. e, Graph shows relative abundance of human IGVH genes Sequence Read Archive accession SRP010970 (orange), and vaccinees (blue). A two-sided binomial test was used to compare the frequency distributions, significant differences are denoted with stars (* p < 0.05, ** p < 0.01, *** p < 0.001, **** = p < 0.0001). f, Clonal relationships between sequences from 14 vaccinated individuals (Moderna in black, Pfizer-BioNTech in red Extended Data Table 3) and naturally infected individuals (in green, from7,8). Interconnecting lines indicate the relationship between antibodies that share V and J gene segment sequences at both IGH and IGL. Purple, green and grey lines connect related clones, clones and singles, and singles to each other, respectively. g, Number of somatic nucleotide mutations in the IGVH (top) and IGVL (bottom) in vaccinee antibodies (Extended Data Table 3) compared to natural infection obtained 1.3 or 6.2 months after infection7,8. Statistical significance was determined using the two-tailed Mann–Whitney U-tests and red horizontal bars indicate mean values. h, as in g, but for CDR3 length.
