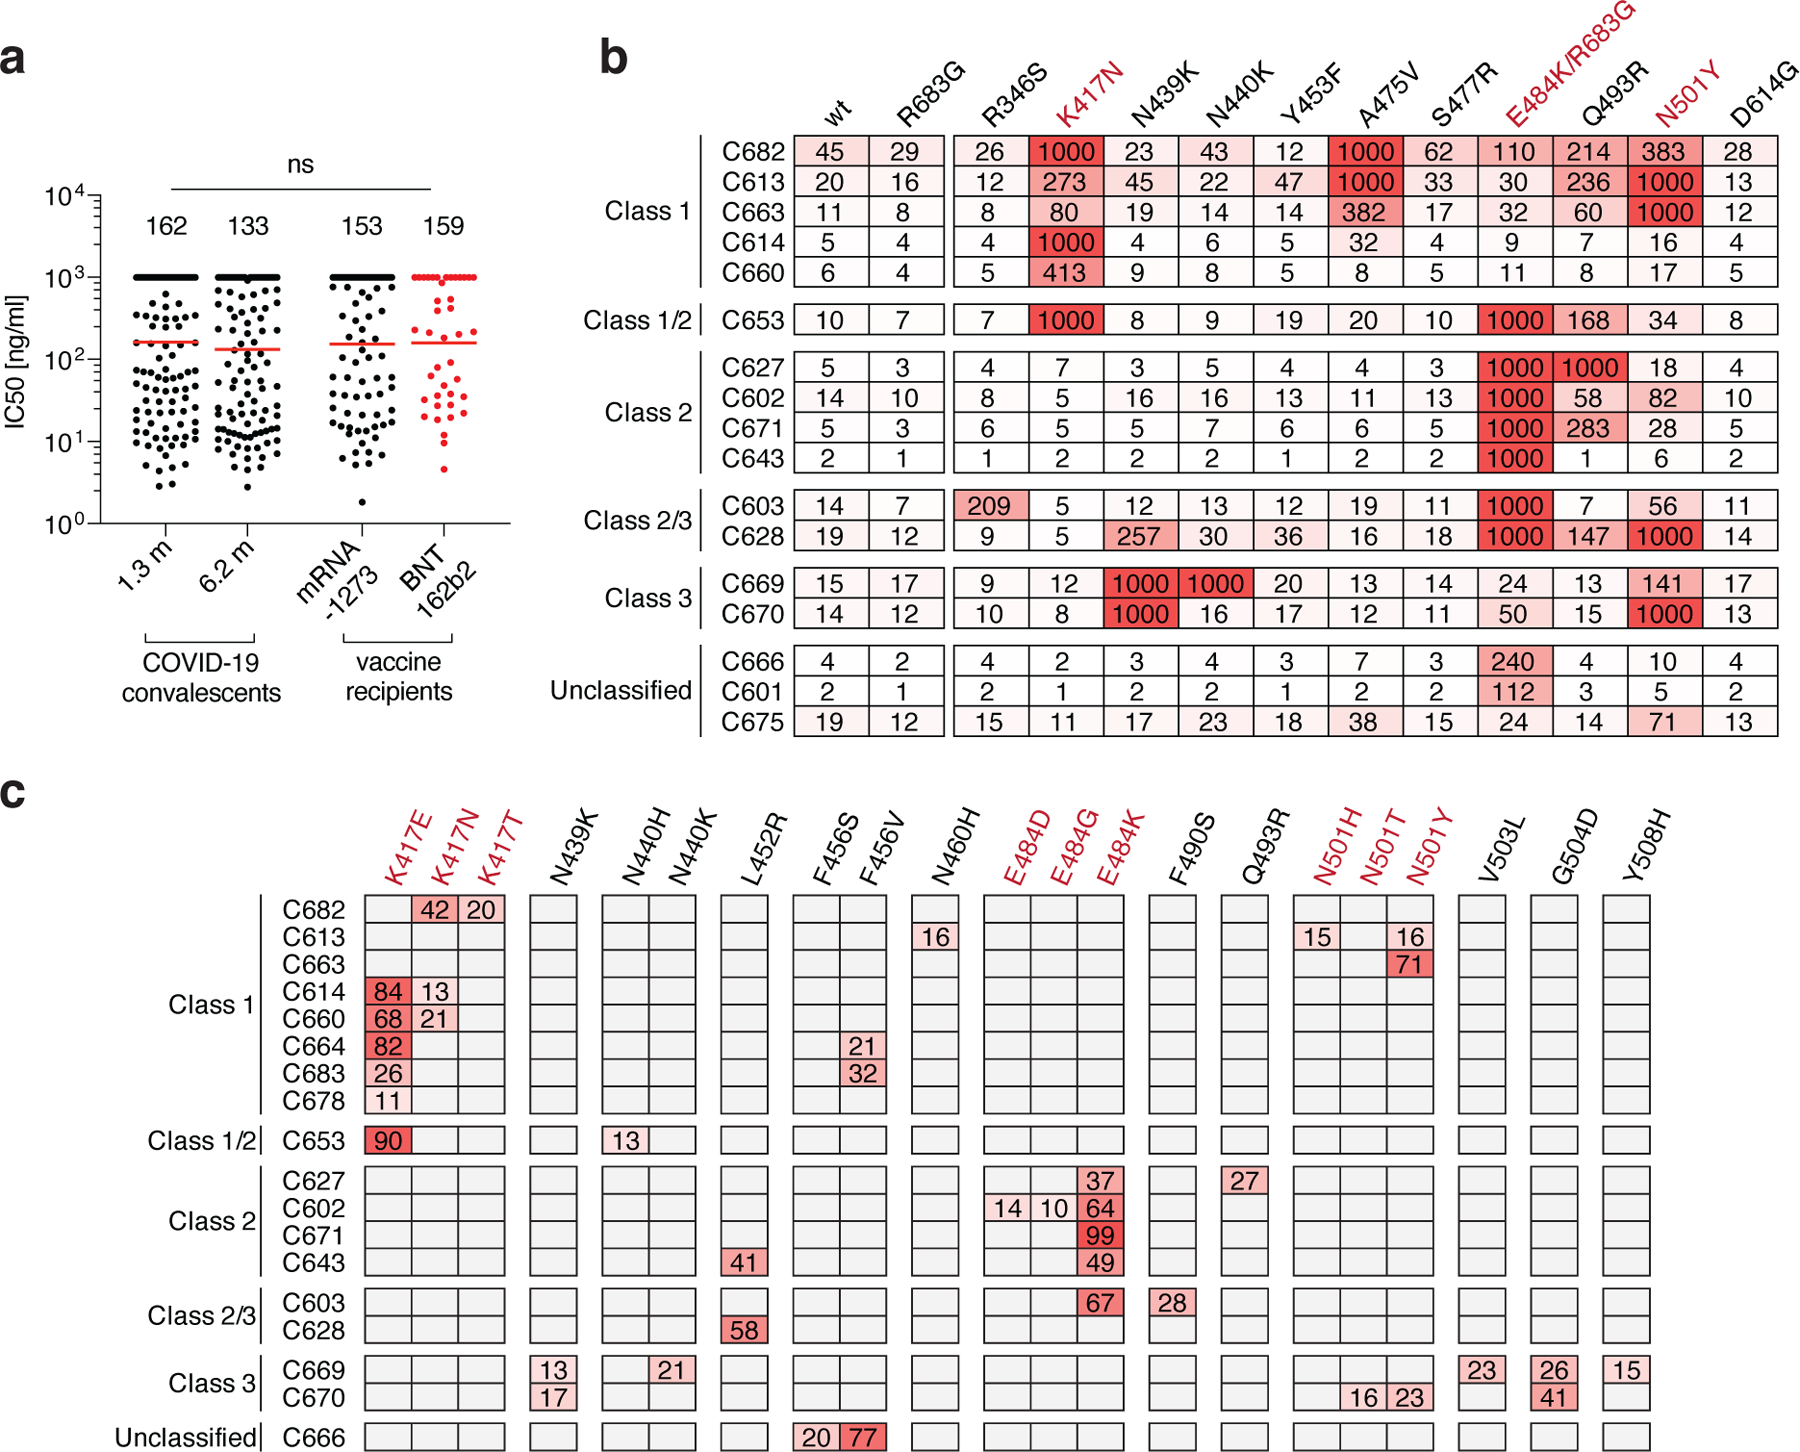
Fig. 3: Anti-SARS-CoV-2 RBD monoclonal antibody neutralizing activity.

a, SARS-CoV-2 pseudovirus neutralization assay. IC50 values for antibodies cloned from COVID-19 convalescent patients measured at 1.3 and 6.2 months7,8 after infection as well as antibodies cloned from Moderna mRNA-1273 (black) and Pfizer-BioNTech BNT162b2 (red) mRNA- vaccine recipients. Antibodies with IC50 values above 1000 ng/ml were plotted at 1000 ng/ml. Mean of 2 independent experiments. Red bars and indicated values represent geometric mean IC50 values in ng/ml. Statistical significance was determined using the two-tailed MannWhitney U-test. Isotype control antibody was analyzed in parallel and showed no detectable neutralization. b, IC50 values for 17 selected mAbs for neutralization of wild type and the indicated mutant SARS-CoV-2 pseudoviruses. Color gradient indicates IC50 values ranging from 0 (white) to 1000 ng/ml (red). c, Antibody selection pressure can drive emergence of S variants in cell culture; the percentage of sequence reads encoding the indicated RBD mutations after a single passage of rVSV/SARS-CoV-2 in the presence of the indicated antibodies is tabulated. Color gradient indicates percentage of sequence reads bearing the indicated mutation ranging from 0 (white) to 100 (red). Positions for which no sequence read was detected are shown in grey. The percentages calculated for a given position are based on all the reads, and not just the reads that include that position. K417N, E484K/R683G and N501 are highlighted in b and c as they constitute important circulating variants.
