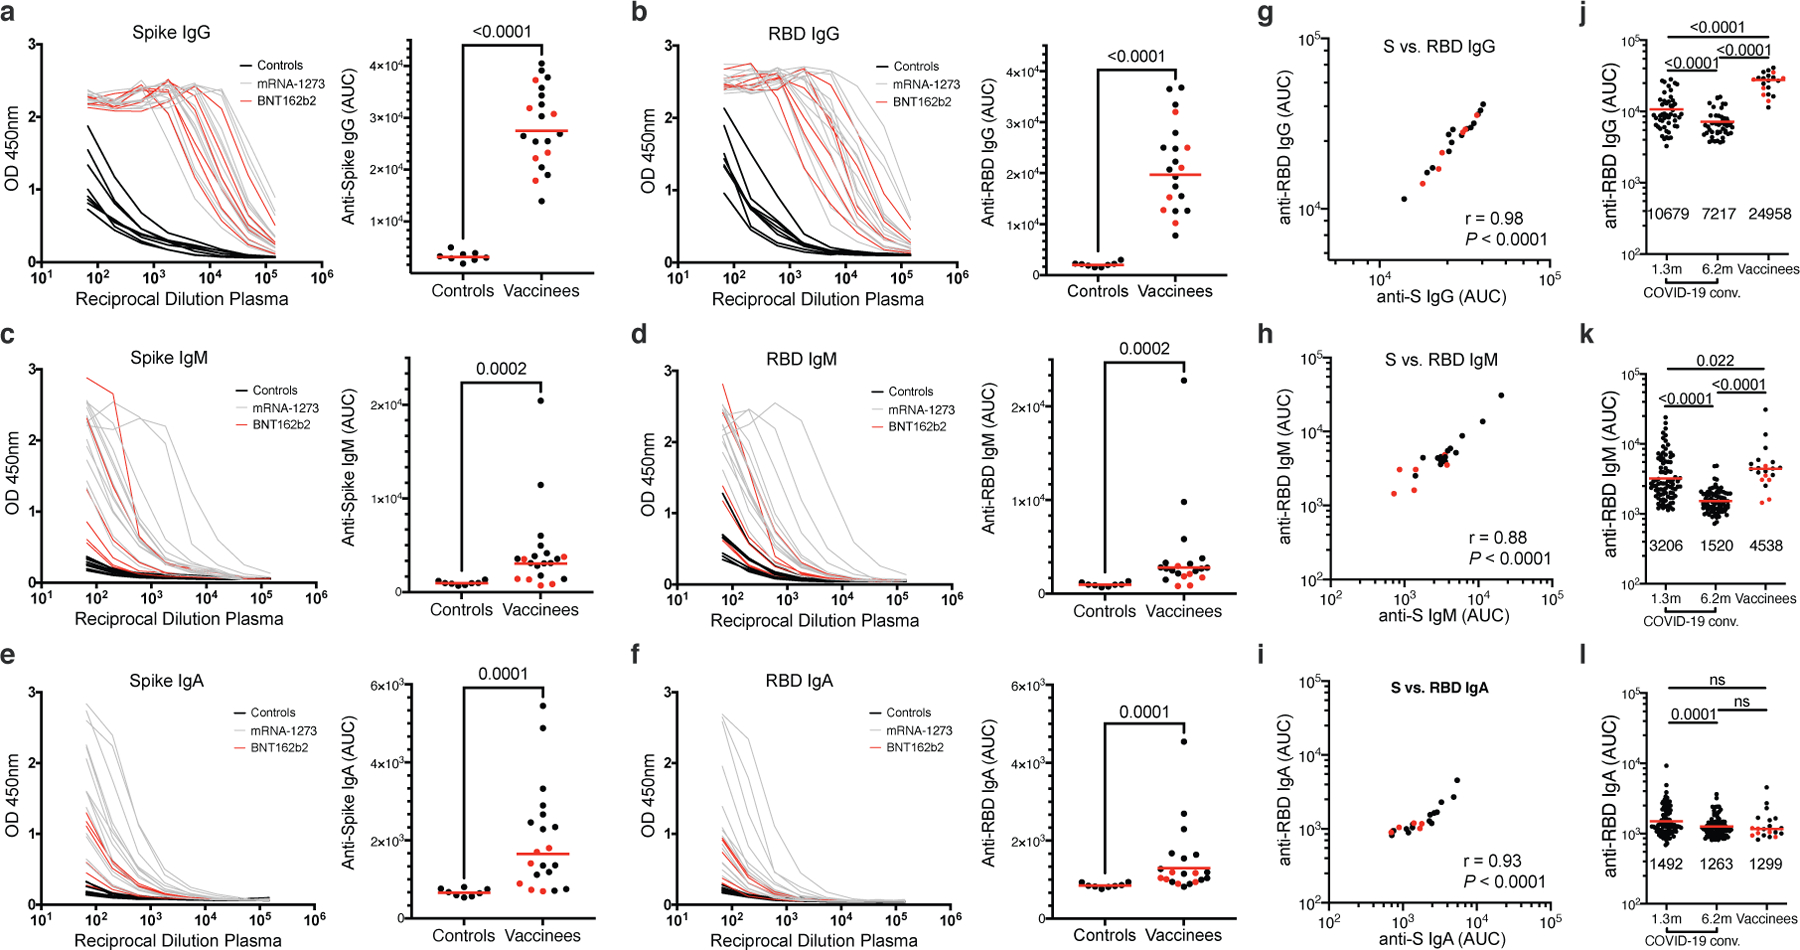
Extended Data Fig. 1. Plasma antibodies against SARS-CoV-2.

a–f, Results of ELISAs measuring plasma reactivity to S (a,c,e) and RBD protein (b,d,f) of 20 vaccinees (grey curves) and 8 controls (black curves). a, Anti-S IgG. b, Anti-RBD IgG. c, Anti-S IgM. d, Anti-RBD IgM. e, Anti-S IgA. f, Anti-RBD IgA. Left, optical density at 450 nm (OD 450 nm) for the indicated reciprocal plasma dilutions. Right, normalized area under the curve (AUC) values for the 8 controls and 20 vaccinees. Horizontal bars indicate geometric mean. Statistical significance was determined using the two-tailed Mann–Whitney U-test. Average of two or more experiments. g–i, Correlations of plasma antibodies measurements. g, Normalized AUC for IgG anti-S (X axis) plotted against normalized AUC for IgG anti-RBD (Y axis). h, Normalized AUC for IgM anti-S (X axis) plotted against normalized AUC for IgM anti-RBD (Y axis). i, Normalized AUC for IgA anti-S (X axis) plotted against normalized AUC for IgA anti-RBD (Y axis). The r and p values in g–i were determined with the two-tailed Spearman’s correlation test. Moderna vaccinees are in black and Pfizer-BioNTech in red. j-l, Results of ELISAs measuring plasma reactivity to RBD in convalescent volunteers 1.3 and 6.2 months after infection7,8 and in 20 vaccinees, who received the Moderna vaccine (black dots) and Pfizer-BioNTech vaccine (red dots). j, Anti-RBD IgG. k, Anti-RBD IgM. l, Anti-RBD IgA. The normalized area under the curve (AUC) values are shown. Positive and negative controls were included for validation. Red horizontal bars and indicated values represent geometric mean. Statistical significance was determined using two-tailed Mann–Whitney U-test or Wilcoxon matched-pairs signed rank test.
