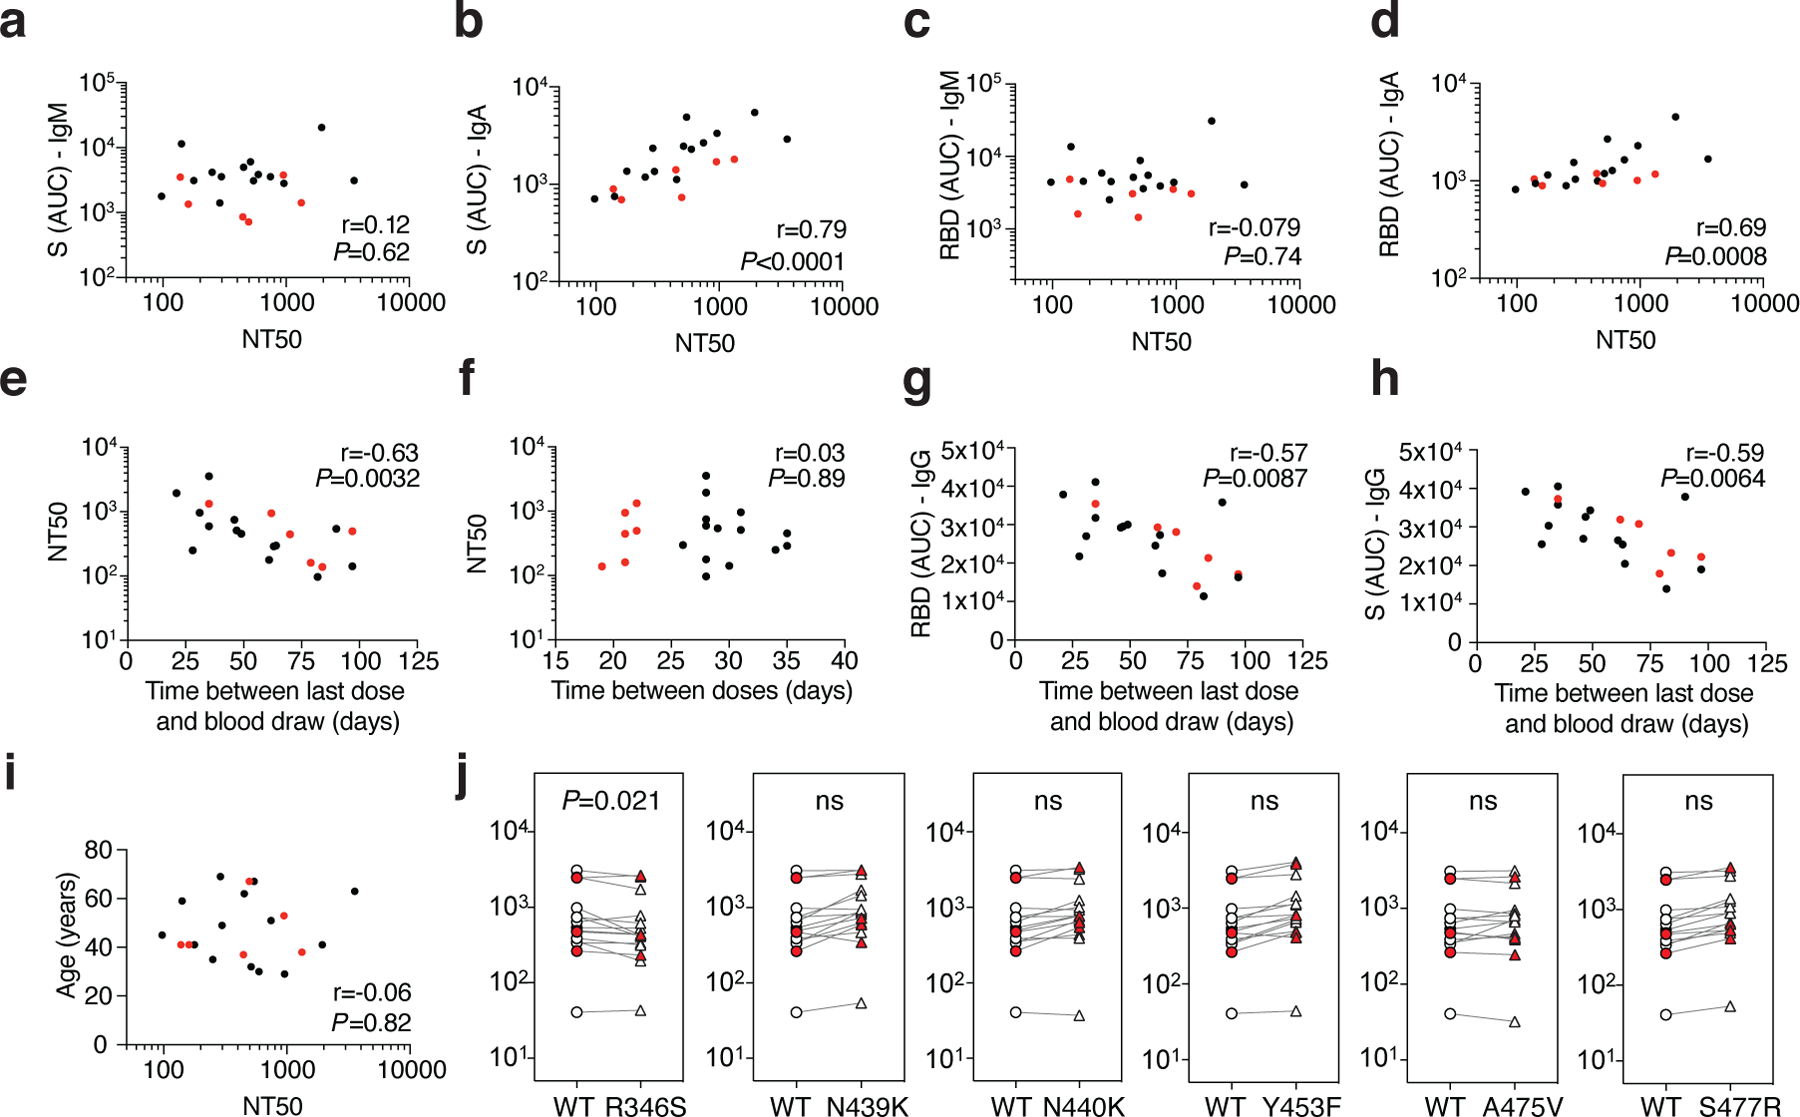
Extended Data Fig. 2: Plasma neutralizing activity.

a, Anti-S IgM AUC (Y axis) plotted against NT50 (X axis) r=0.12, p<0.62. b, Anti-S IgA AUC (Y axis) plotted against NT50 (X axis) r=0.79, p<0.0001. c, Anti-RBD IgM AUC (Y axis) plotted against NT50 (X axis) r=−0.079 p=0.74. d, Anti-RBD IgA AUC (Y axis) plotted against NT50 (X axis) r=0.69 p=0.0008. e, NT50 (Y axis) plotted against time between last dose and blood draw (X axis) r=−0.63 p=0.0032. f, NT50 (Y axis) plotted against time between doses (X axis) r=0.03 p=0.89. g, Anti-RBD IgG AUC (Y axis) plotted against time between last dose and blood draw (X axis) r=−0.57 p=0.0084. h, Anti-S IgG AUC (Y axis) plotted against time between last dose and blood draw (X axis) r=−0.59 p=0.0064. i, Age (Y axis) plotted against NT50 (X axis) r=−0.06 p=0.82. The r and p values were determined by two-tailed Spearman’s. Moderna vaccinees in black and Pfizer-BioNTech in red. j, NT50 values for vaccinee plasma (n=15) neutralization of pseudotyped viruses with WT and the indicated RBD-mutant SARS-CoV-2 S proteins; p-values determined using one tailed t-test.
