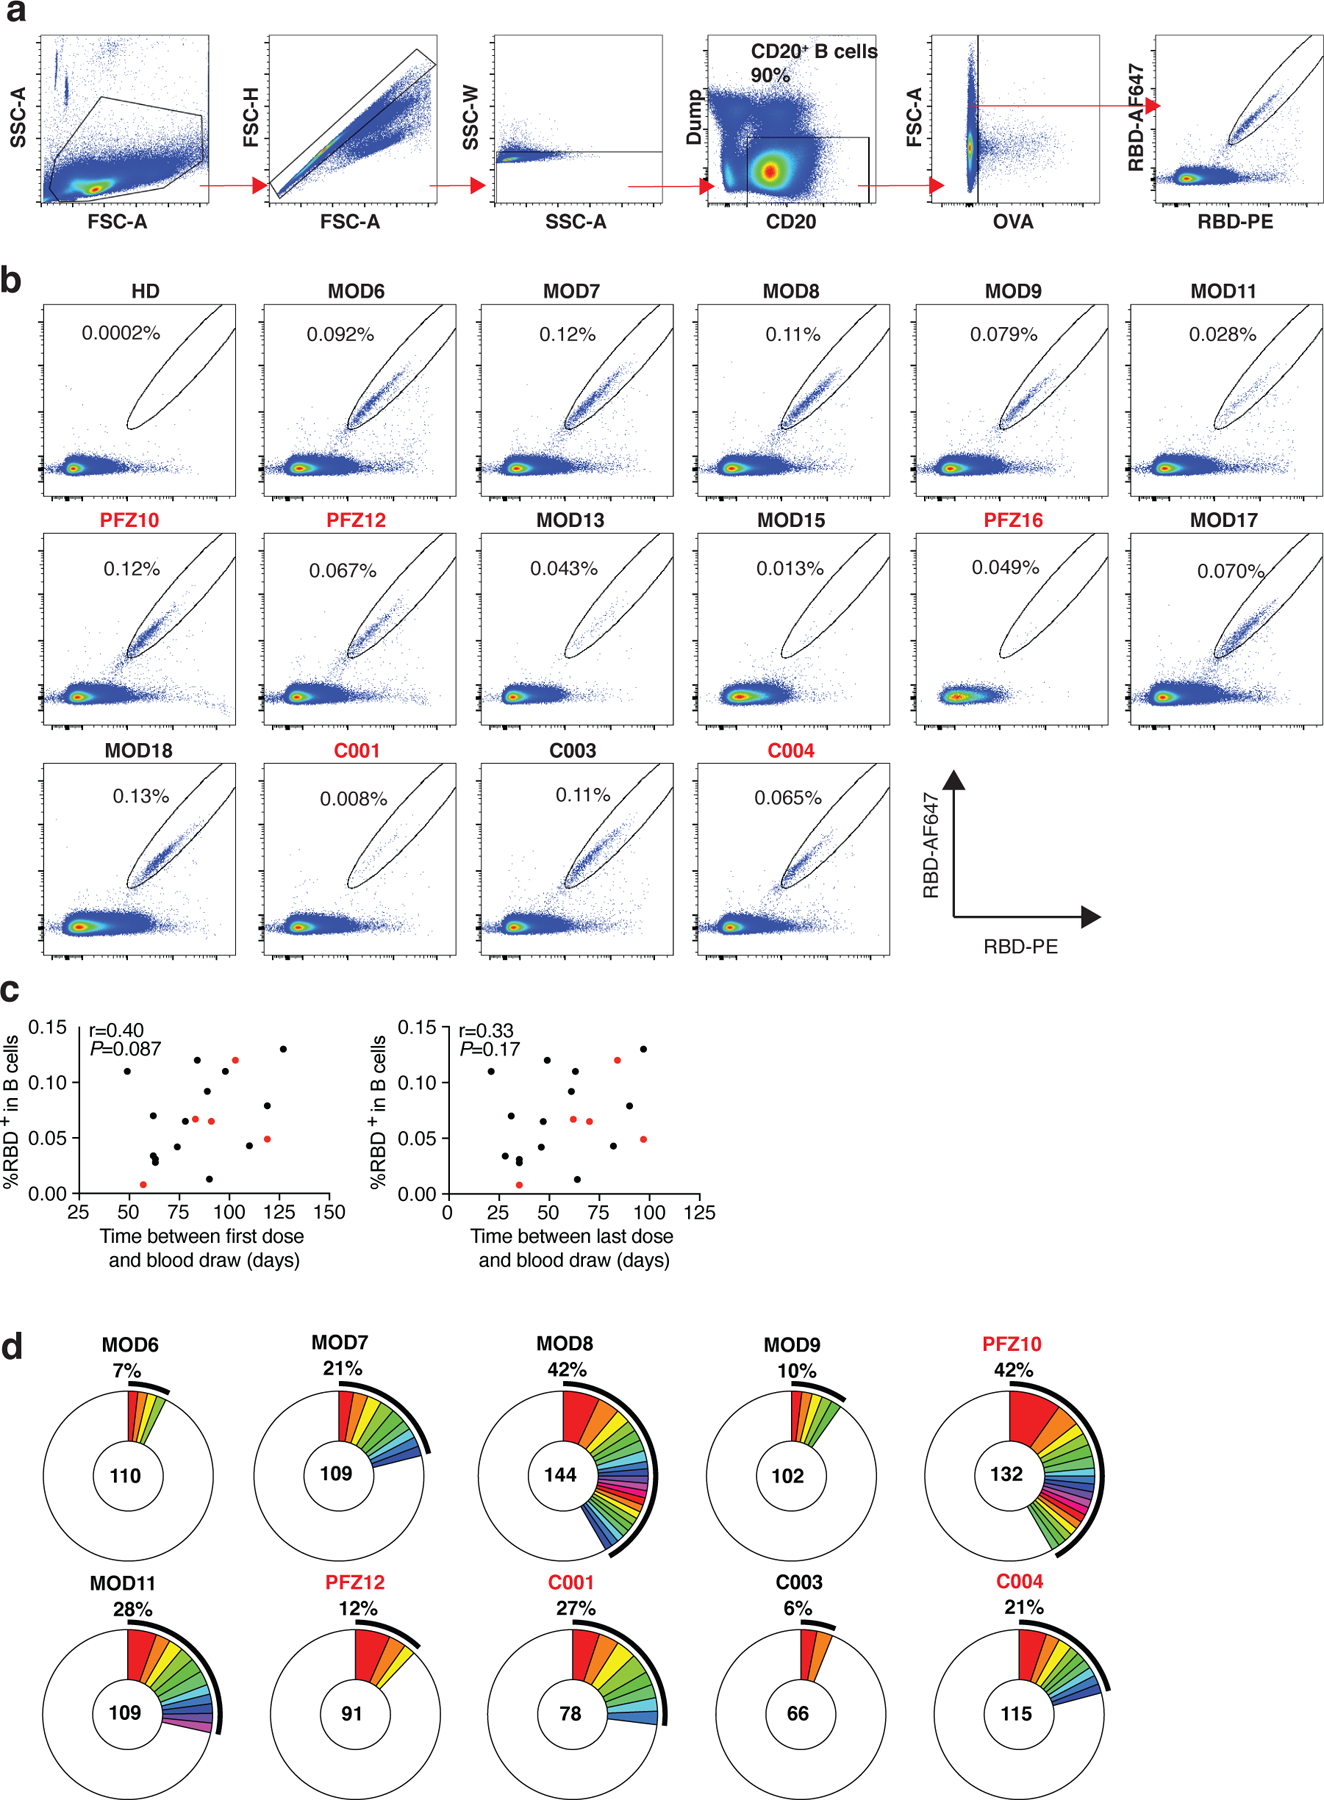
Extended Data Fig. 3: Flow cytometry.

a, Gating strategy used for cell sorting. Gating was on singlets that were CD20+ and CD3-CD8-CD14-CD16-OVA-. Sorted cells were RBD-PE+ and RBD-AF647+. b, Flow cytometry showing the percentage of RBD-double positive memory B cells from a pre-COVID-19 control (HD) and 15 vaccinees, who received the Moderna vaccine are shown in black and Pfizer-BioNTech vaccine recipients are in red. c, the percentage of RBD-binding memory B cells in vaccinees (Y axis) plotted against time between first dose and blood draw (X axis) r=0.40 p=0.087 (left panel), and between last dose and blood draw (X axis) r=0.33 p=0.17 (right panel). Moderna vaccinees in black and Pfizer-BioNTech in red. The r and p values for correlations were determined by two-tailed Spearman’s. d, Pie charts show the distribution of antibody sequences from 10 individuals in b. The number in the inner circle indicates the number of sequences analyzed. Pie slice size is proportional to the number of clonally related sequences. The black outline indicates the frequency of clonally expanded sequences. The r and p values for correlations in c were determined by the two-tailed Spearman correlation test.
