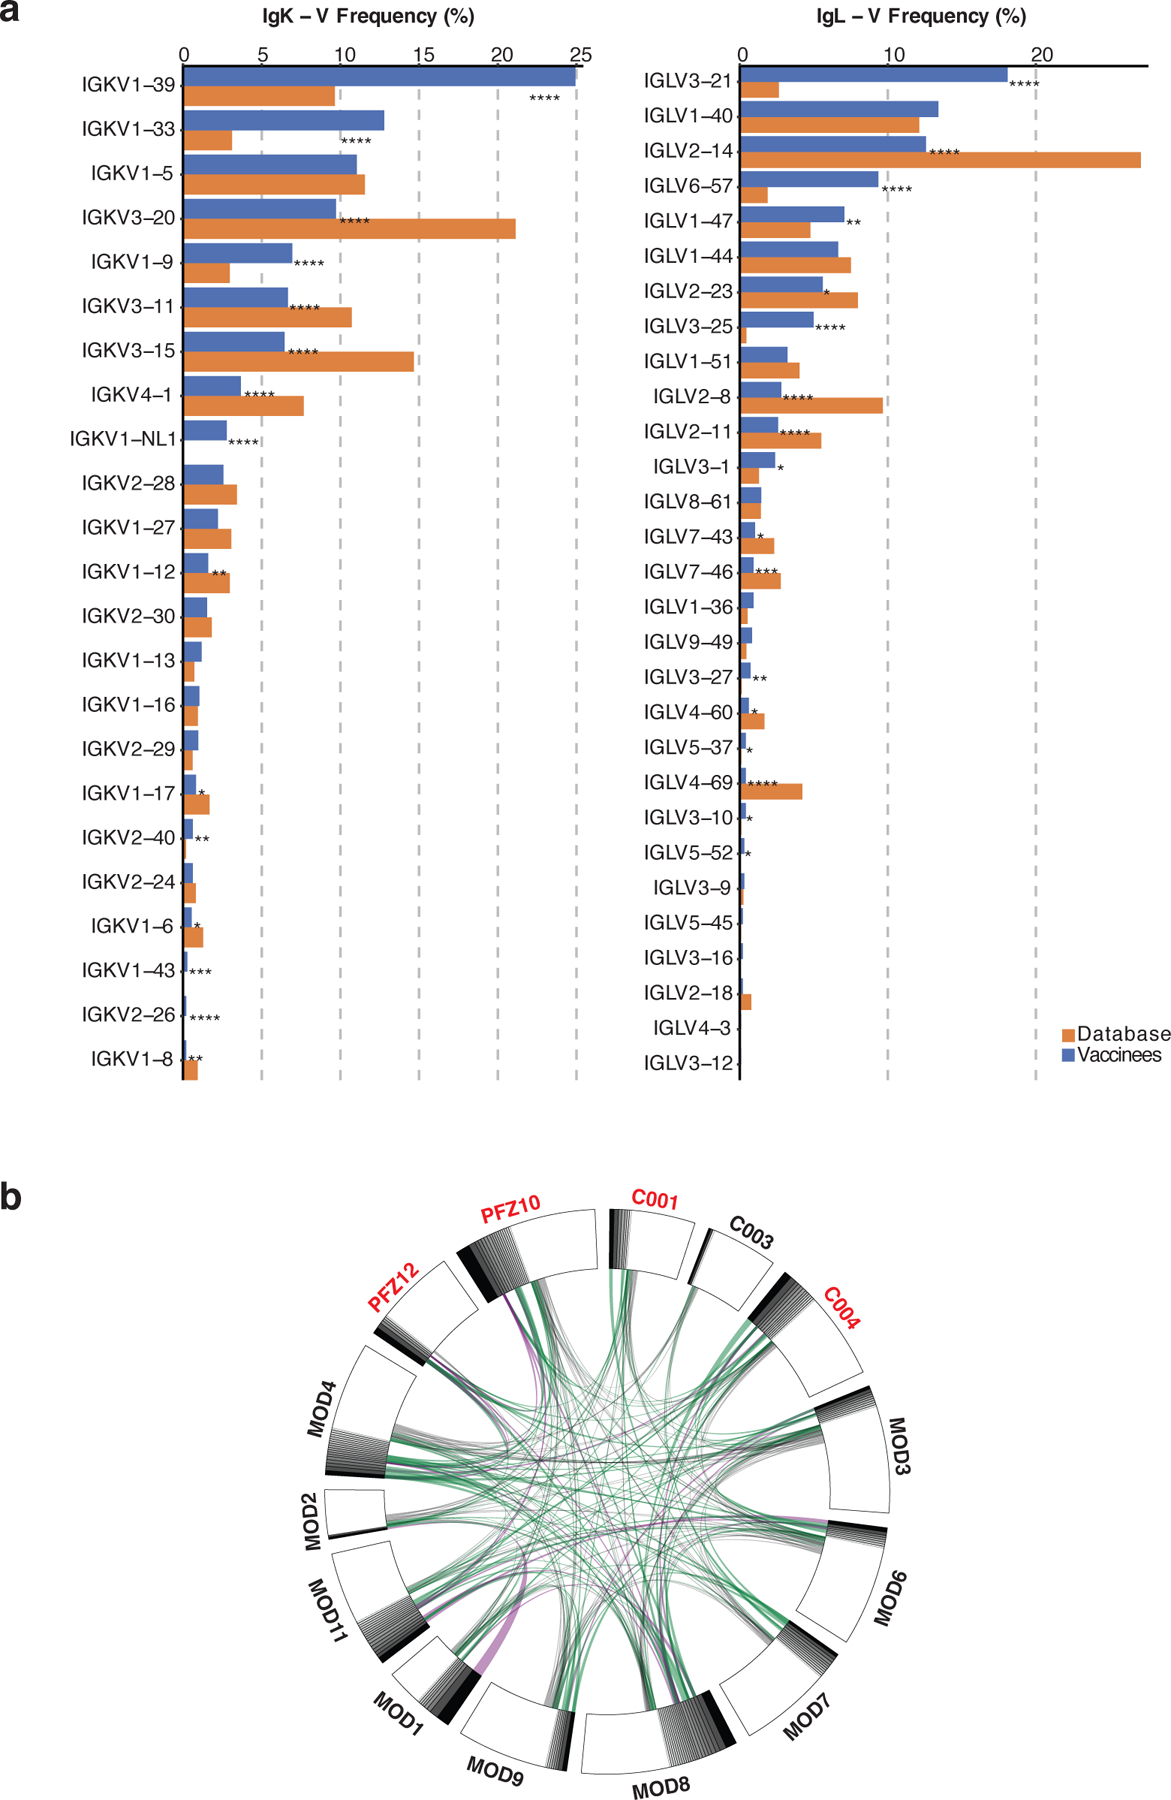
Extended Data Fig. 4: Frequency distributions of human VL genes.

Graph shows relative abundance of human IGVK (left) and IgVL (right) genes of Sequence Read Archive accession SRP010970 (orange)65, and vaccinees (blue). Two-sided binomial tests with unequal variance were used to compare the frequency distributions., significant differences are denoted with stars (* p < 0.05, ** p < 0.01, *** p < 0.001, **** = p < 0.0001). b. Sequences from 14 individuals (Extended Data Table 3) with clonal relationships. Interconnecting lines indicate the relationship between antibodies that share V and J gene segment sequences at both IGH and IGL. Purple, green and grey lines connect related clones, clones and singles, and singles to each other, respectively.
