
Figure 8.
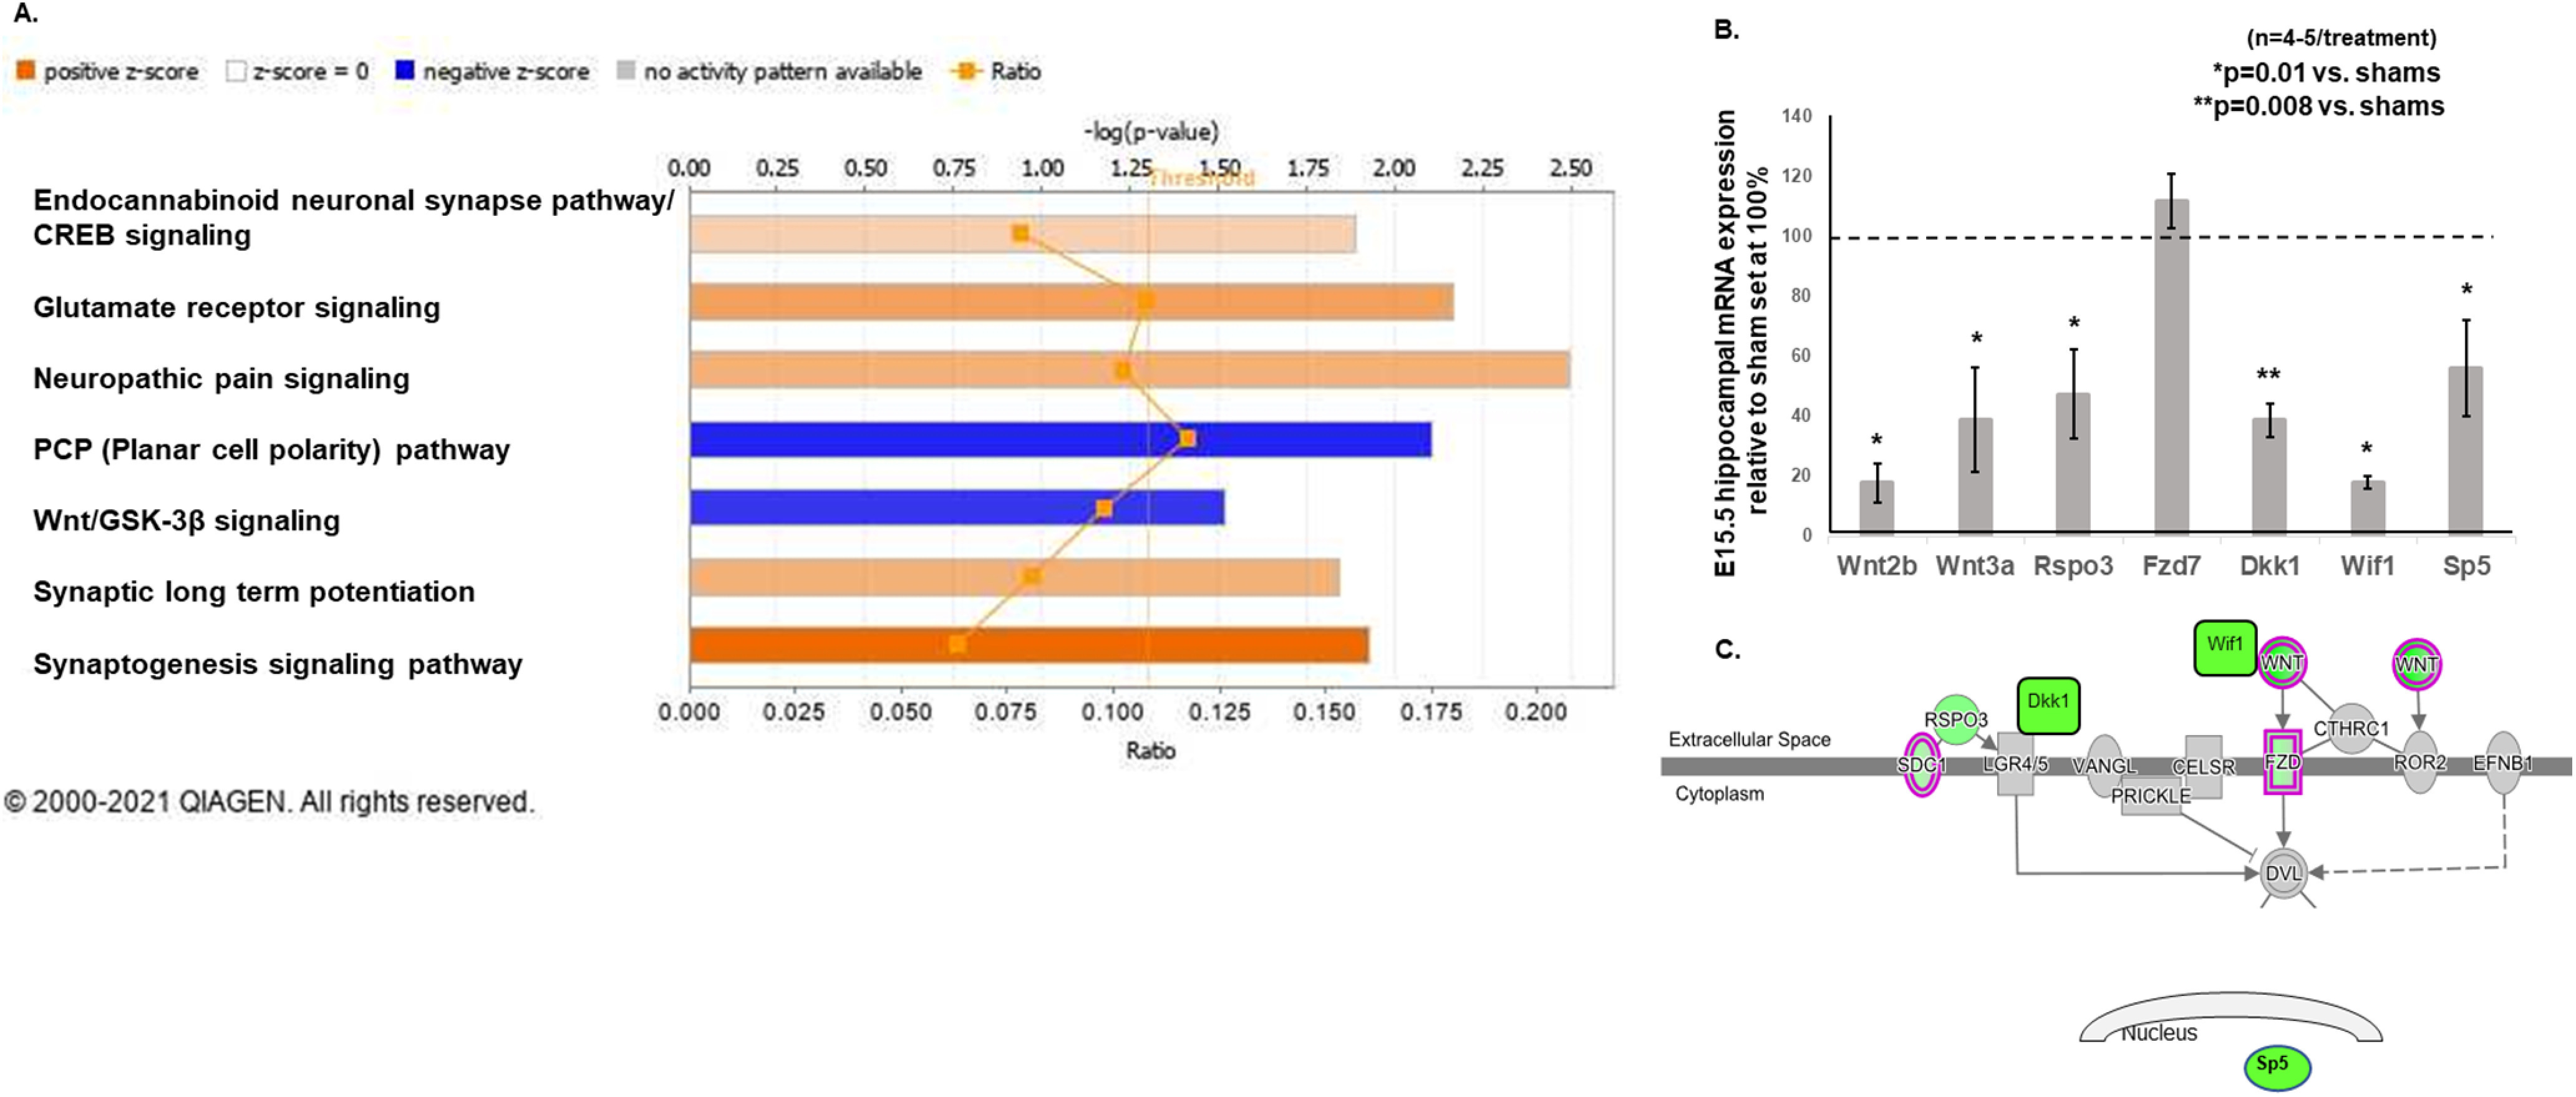
A, Ingenuity Pathway Analysis of the 611 differentially expressed protein-coding genes to determine canonical pathways that were altered in IUGR at E15.5. We used z scores >1.0 as the cutoff to determine predicted downregulated or upregulated activity. The canonical Wnt/GSK-3β and noncanonical (PCP) pathways were predicted to have downregulated activity in IUGR (blue bars denoting negative z scores determined by the IPA Canonical Pathway algorithm, which infers likely deactivation states of biological functions based on comparison with a model that assigns random regulation directions). The glutamate receptor signaling pathway, which shared the same differentially expressed genes as the endocannabinoid neuronal synapse pathway, CREB signaling, neuropathic pain signaling pathway, synaptic long-term potentiation, and synaptogenesis signaling pathway, was predicted to have upregulated activity in IUGR (orange bars denoting positive z scores determined by the IPA Canonical Pathway algorithm, which infers likely activation states of biological functions based on comparison with a model that assigns random regulation directions). Pathways with –log(p value) above the orange threshold line denoted a significance of p ≤ 0.05. Ratio signified the number of genes detected in RNA-seq in that pathway divided by the number of genes known in that pathway. B, Genes of canonical and noncanonical Wnt (PCP) signaling pathways discovered from RNA-seq were validated with qRT-PCR in a separate cohort of E15.5 hippocampi. IUGR reduced hippocampal gene transcripts of Wnt2b and Wnt3a ligands, Rspo3 ligand for the PCP pathway, Dkk1 and Wif1 inhibitors, and Sp5, a readout of the canonical pathway. Sham values were normalized to 100%, and IUGR-induced changes were expressed as percentages of sham values. *p = 0.01 compared with sham controls. **p = 0.008 compared with sham controls. Student’s t test was used to compare sham and IUGR offspring. No differences were noted when sex was separated. C, A representative diagram showing the localization of canonical and noncanonical (PCP) signaling gene transcripts that were decreased by IUGR. Green color within each gene denoted decreased gene expression in the analysis.