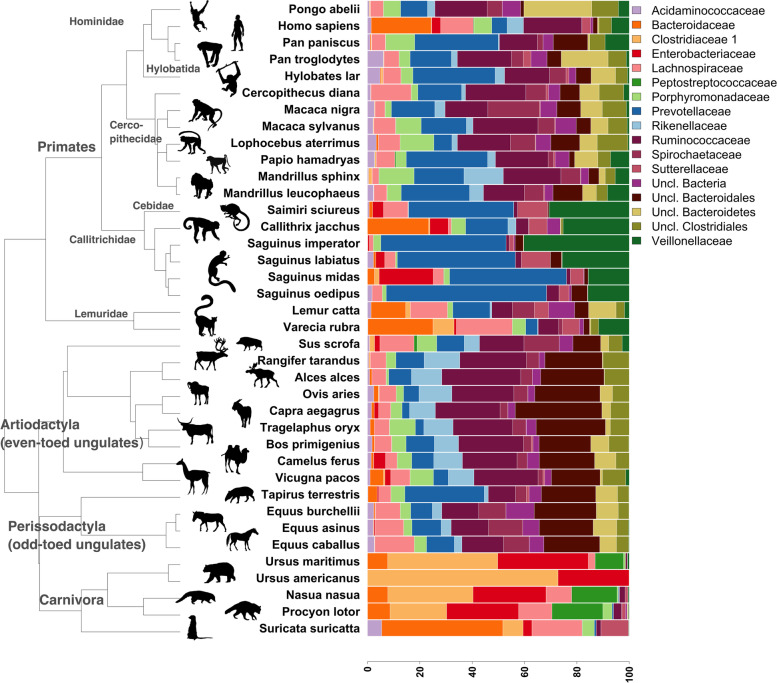
Fig. 1.
Mammals gut bacterial profile by host phylogeny. Mapping of family-level microbiome mean relative abundances (17 most abundant) onto host phylogenetic tree (built using http://timetree.org/) revealed clear clustering of microbiome profile by host clade. A total of 38 different host species with microbiome data are included, and microbiome data aggregated at family level keeping unannotated clades (seen as uncl. (unclassified) in legend). Icons taken from http://phylopic.org/. Credits to Rebecca Groom, Roberto Díaz Sibaja, Sarah Werning

