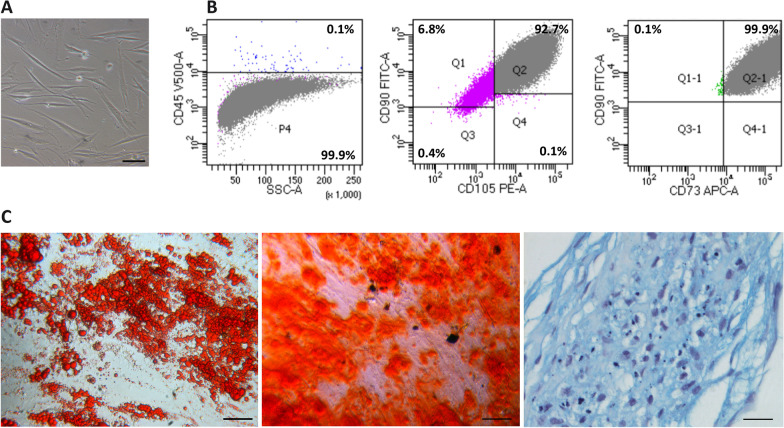
Fig. 2.
Characterization of hASCs. A Phase contrast micrograph of in vitro cultured cells isolated from the adipose tissue biopsies. Scale bar = 100 μm. B Cytofluorimetric analyses showing absence of CD45 (left) and positivity for CD105, CD90 and CD73 (centre and right) in the putative hASCs obtained in culture. C Trilineage mesenchymal differentiation potential of hASCs into adipocytes (left), osteoblast (centre) and chondroblast (right), as confirmed through staining of lipid droplets with Oil Red O, mineralized matrix deposition with Alizarin Red S and sulphated proteoglycan deposition with Alcian Blue, respectively. Scale bar left and centre = 100 μm, scale bar right = 25 μm

