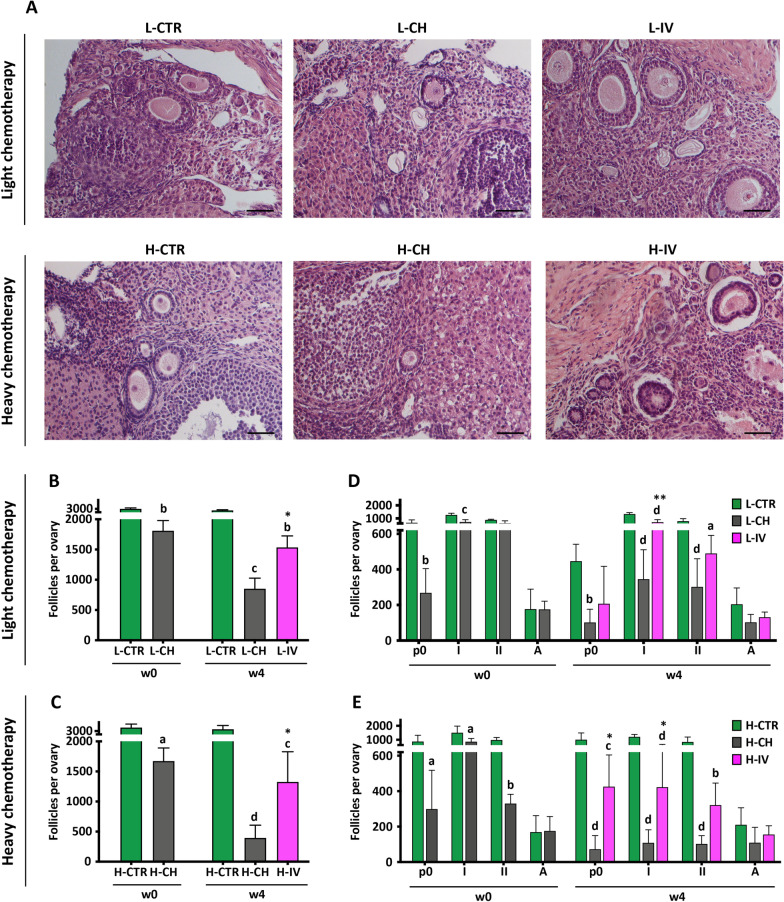
Fig. 4.
Follicle morphology, count and classification. A Representative micrographs of different categories of follicles containing oocyte present in sections of ovaries obtained from animals subjected to the indicated treatments. Scale bar = 50 μm. B, C Total number of follicles per ovary. Values are expressed as mean ± SD. Significance is calculated with t-test (w0) and with One-way ANOVA (w4) vs CTR (letters) and vs CH (asterisks) as described in "Methods". D, E Number of follicles per ovary in function of the maturation stage: primordial (p0), primary (I), secondary (II) and antral (A). Values are expressed as mean ± SD. Significance is calculated with Two-way ANOVA vs CTR (letters) and vs CH (asterisks) as described in "Methods". Sample size: n ≥ 3 and n ≥ 4 for light (L) and heavy (H) chemotherapeutic treatment, respectively

