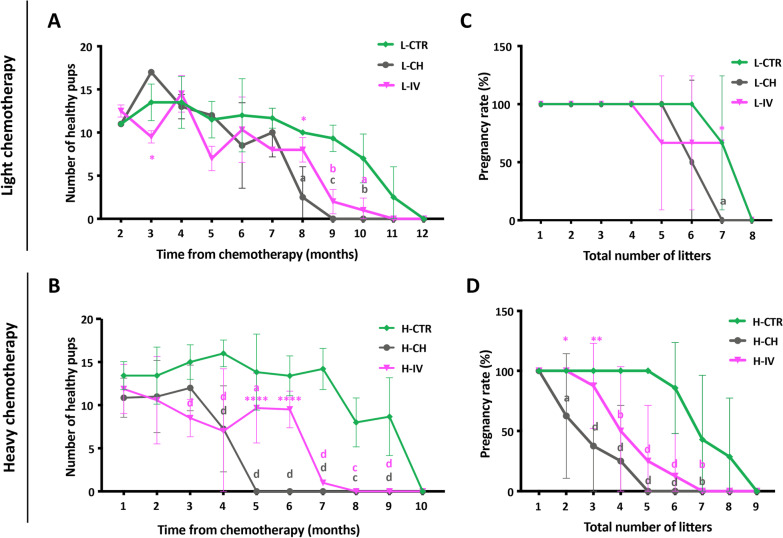
Fig. 6.
Analysis of mice fertility after natural mating. A, B Number of healthy pups delivered by females at each month along their reproductive lives. Values are expressed as means ± SD. Significance is calculated with Two-way ANOVA vs CTR (letters) and vs CH (asterisks) as described in "Methods". Sample size: n = 3 and n ≥ 7 for light (L) and heavy (H) chemotherapeutic treatment, respectively. C, D Percentage of females that became pregnant and delivered the indicate number of litters. Values are expressed as means ± SD. Significance is calculated with Two-way ANOVA vs CTR (letters) and vs CH (asterisks) as described in "Methods". Sample size: n = 3 and n ≥ 7 for light (L) and heavy (H) chemotherapeutic treatment, respectively

