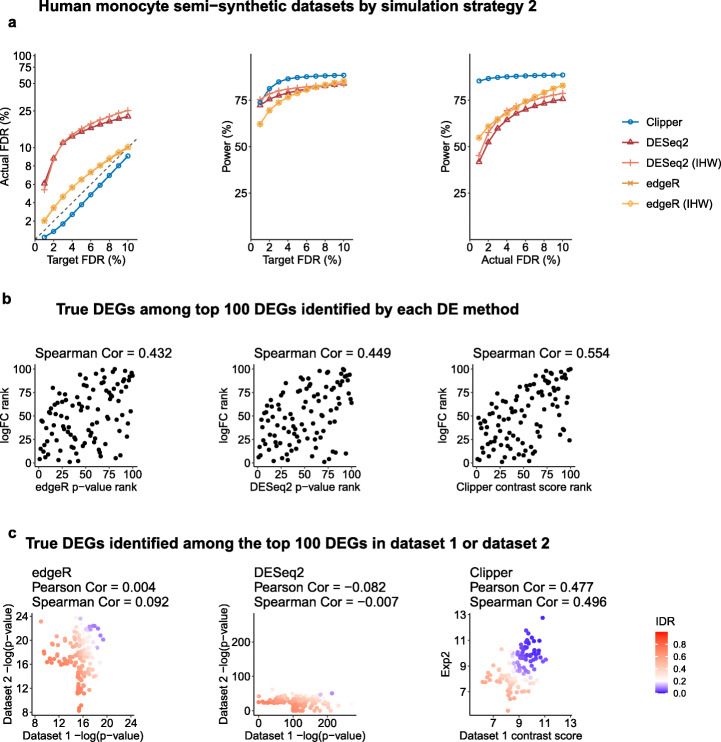
Fig. 4.
Comparison of Clipper and two popular DEG identification methods—edgeR and DESeq2—in DEG analysis on semi-synthetic bulk RNA-seq data (generated from human monocyte real data using simulation strategy 2 in Additional File 1: Section S6.3). a FDR control, power given the same target FDR, and power given the same actual FDR. b Ranking consistency of the true DEGs among the top 100 DEGs identified by each method. The consistency is defined between the genes’ ranking based on edgeR/DESeq2’s p-values or Clipper’s contrast scores and their ranking based on true expression fold changes. c Reproducibility between two semi-synthetic datasets as technical replicates. Three reproducibility criteria are used: the IDR, the Pearson correlation, and the Spearman correlation. Each criterion is calculated for edgeR/DESeq2’s p-values or Clipper’s contrast scores on the two semi-synthetic datasets. Among the three methods, only Clipper controls the FDR, and Clipper achieves the highest power, the best gene ranking consistency, and the best reproducibility

