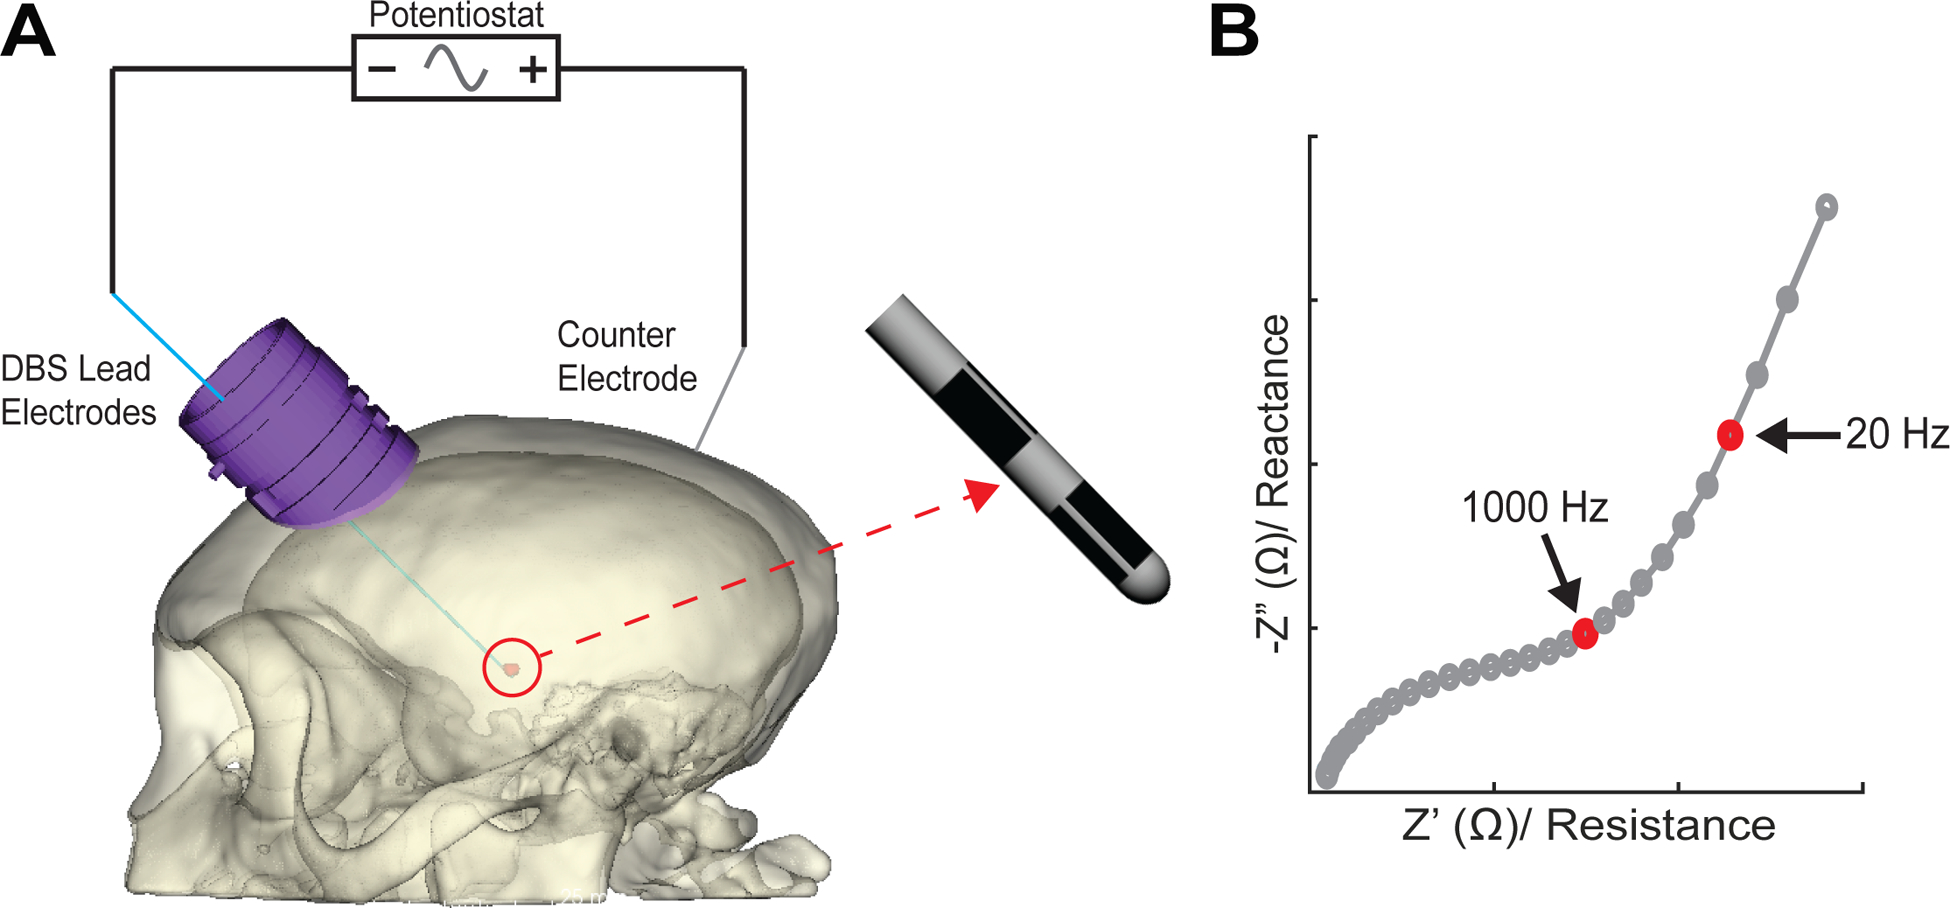
Figure 3.

EIS measurements. (A) Impedances were measured between a working electrode on the DBS lead and a counter electrode either as a silver chloride wire in the DBS chamber or a distributed set of bone screws over the posterior cranium. (B) Shown is a Nyquist plot of an example impedance spectroscopy measurement highlighting between 1 kHz and 20 Hz resistance and reactance. The latter measurement was chosen given its relevance to typical beta-band frequencies (12–30 Hz).
