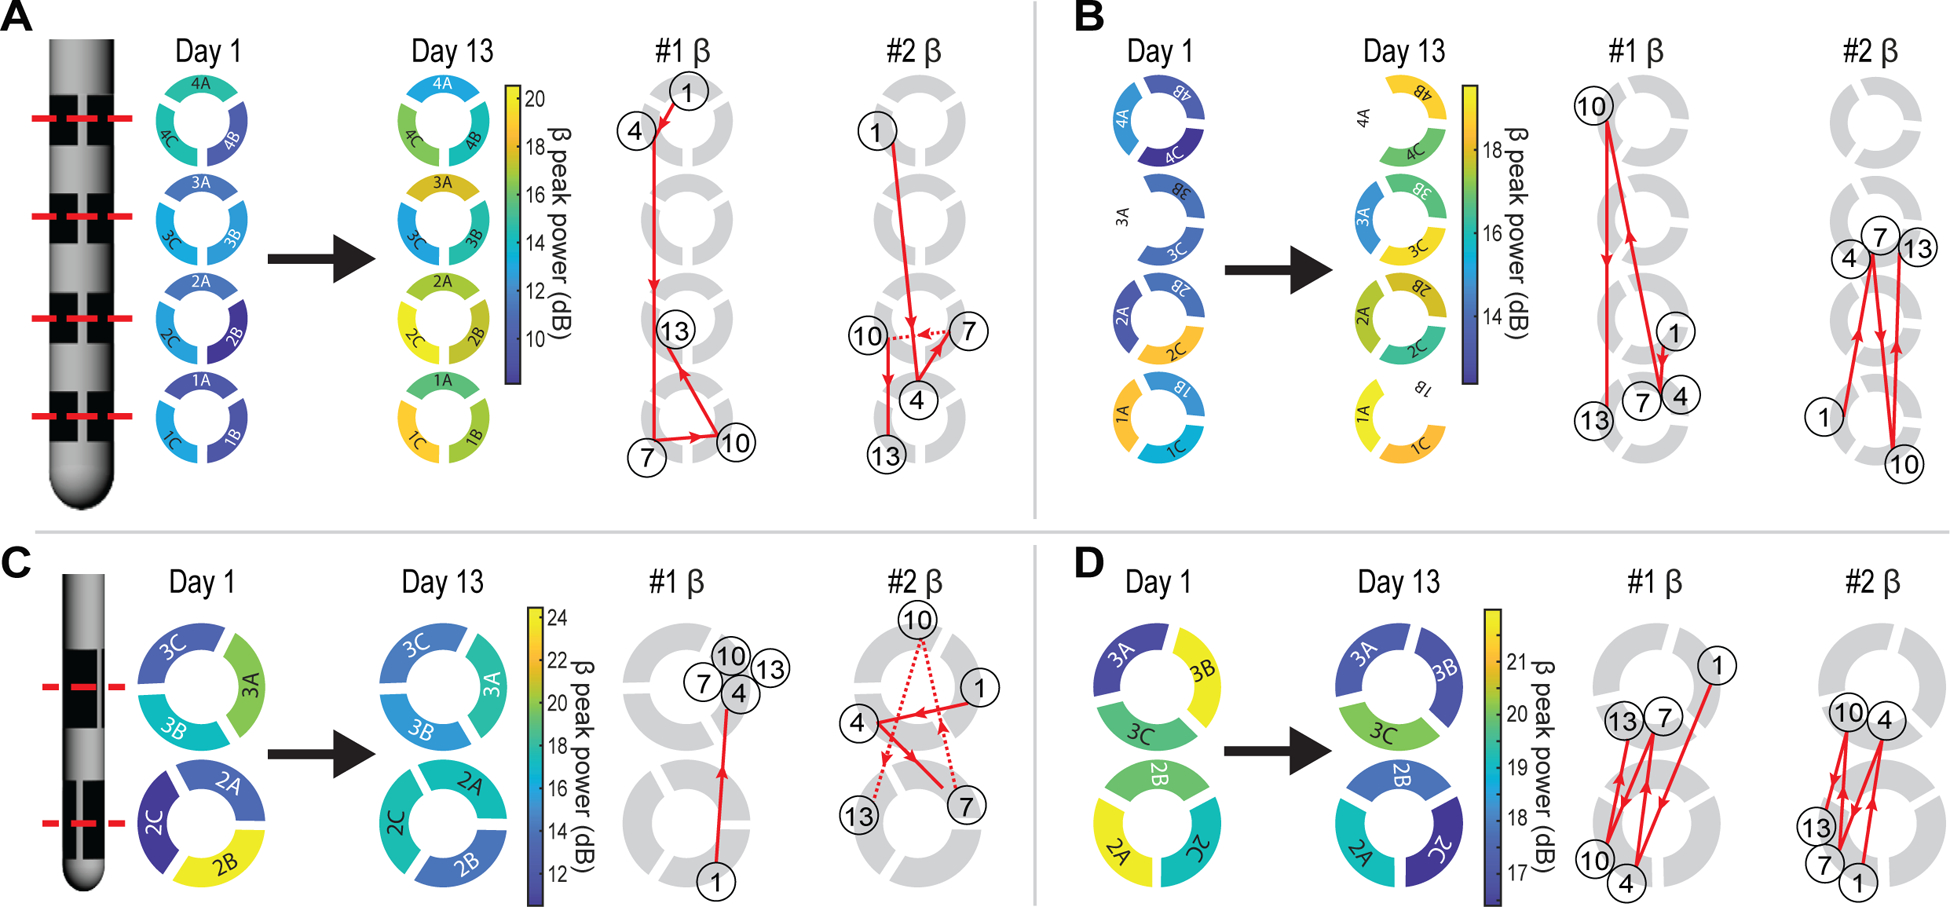
Figure 5.

Spatiotemporal dynamics of LFP characteristics using CAR following DBS lead implantation for subjects (A) S1, (B) S2, (C) S3, and (D) S4. Left, spatial maps of beta-band (12–30 Hz) peak power on day 1 and day 13 show uncorrelated peri-implant and semi-chronic beta power distributions. White electrodes were excluded from analysis. Right, trajectories show trends of the electrodes with the highest (#1) and second highest (#2) beta-band peak power from day 1 to day 13. The number in each circle denotes the day. Circle location denotes the electrode with the highest, or second highest, beta-band peak power for that day.
