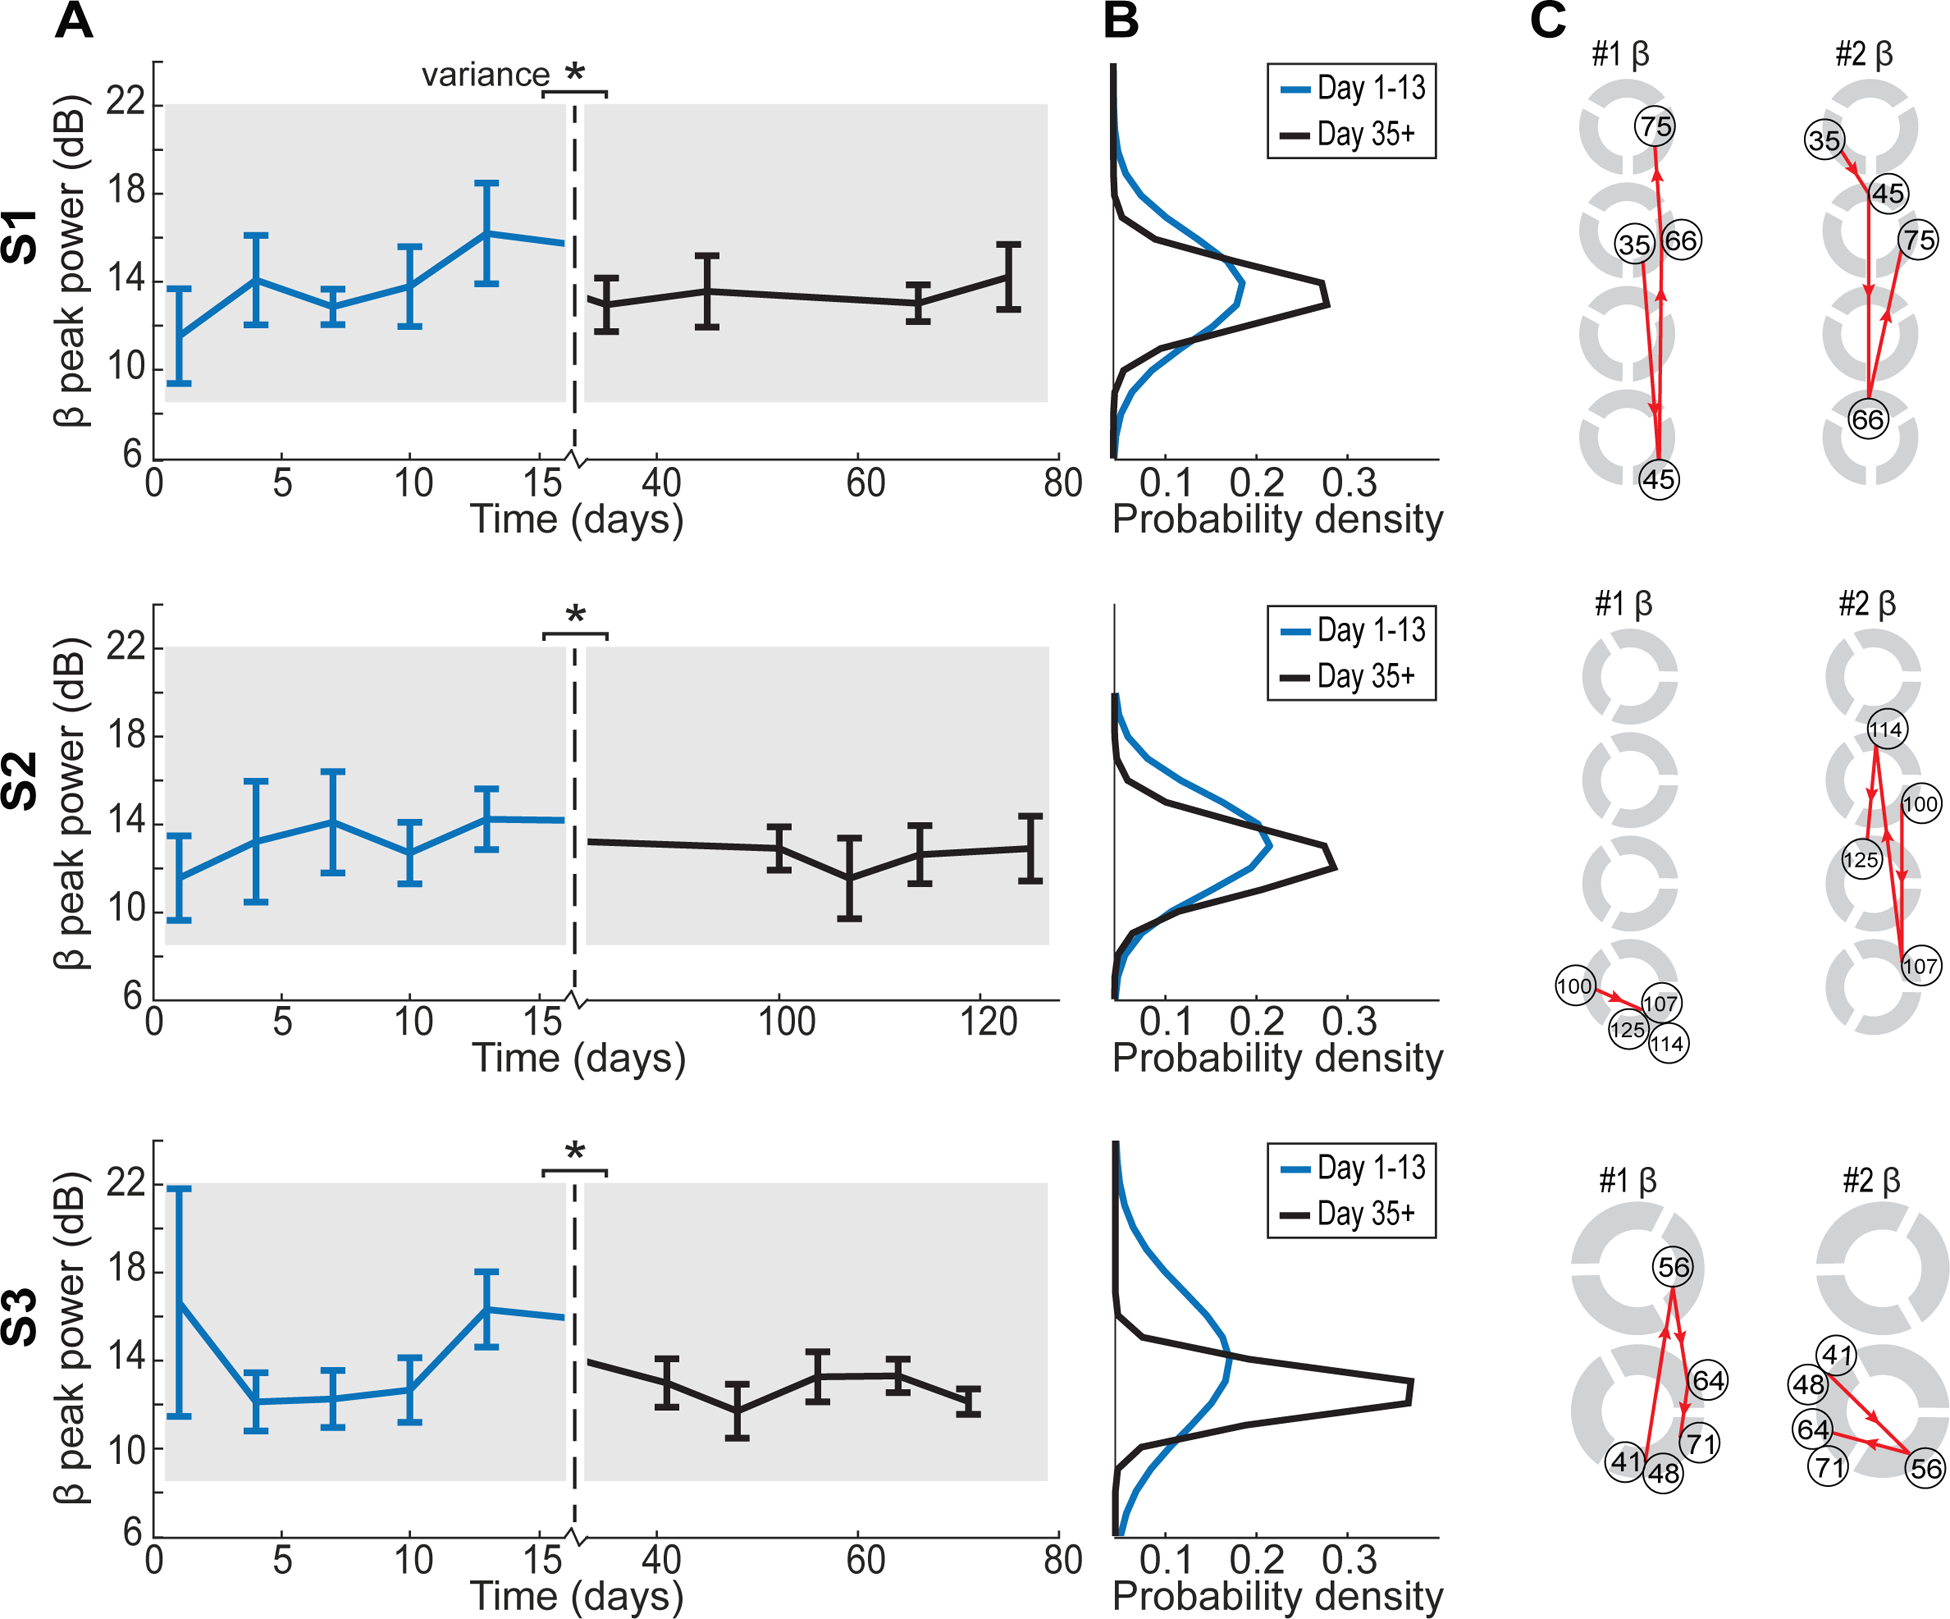
Figure 7.

Longer term beta-band (12–30 Hz) peak power trends. (A) Average temporal trends revealed significant decreases in the variance of beta peak power across all electrodes after 35 d (Wilcoxon rank sum: *p < 0.05). (B) Variance is plotted as probability density functions. (C) Trajectories showed trends of the electrodes with the highest (left) and second highest (right) beta-band peak power for days 35+ for S1, S2, and S3.
