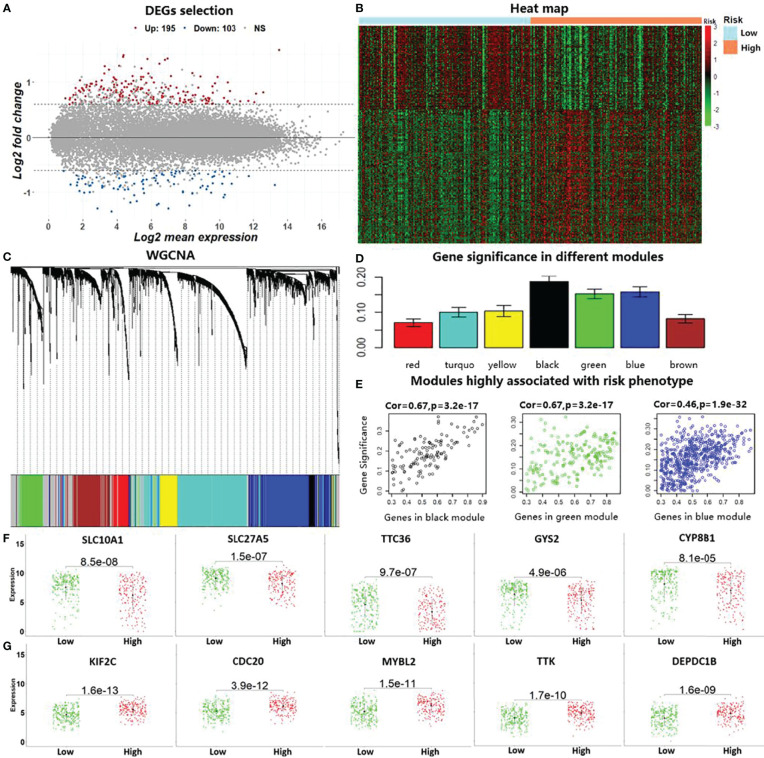
Figure 4.
Identification of prognostic markers by conducting differential expression analysis and weighted gene co-expression network analysis (WGCNA). (A) The 298 identified differentially expressed genes (DEGs) with |log2 fold change| >0.7 and corrected p-values <0.05 in the liver cancer data (LIHC) in TCGA. (B). Heat map using the DEGs with predicted risk subgroups in LIHC. (C). WGCNA for calculating co-expression modules. (D). Computed average gene significance values in the different modules. (E) Three identified modules that are associated with risk phenotypes in hepatocellular carcinoma (HCC). (F) Differences in the identified downregulated risk genes in the HCC risk subgroups by gene expression level. (G) Differences in the identified upregulated risk genes in the HCC risk subgroups.

