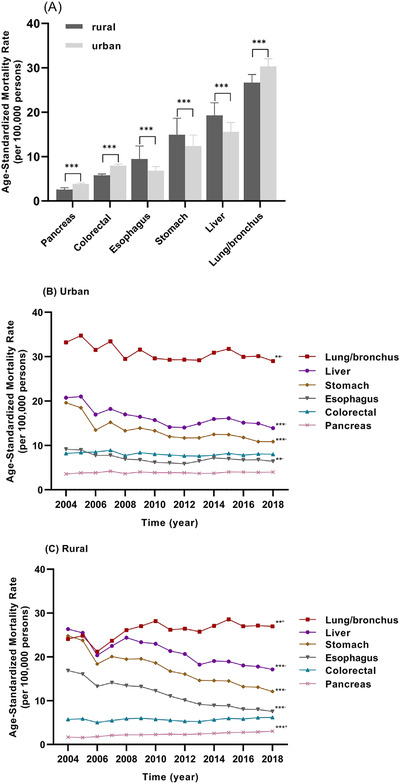
FIGURE 4.

The age‐standardized mortality rates per 100,000 for six major cancer types in urban and rural populations in mainland China during 2004‐2018; (A) comparison of the age‐standardized mortality rates per 100,000 of the six major cancer types in urban and rural populations; (B) trends in the age‐standardized mortality rates of six major cancer types in urban population, 2004‐2018; (C) trends in the age‐standardized mortality rates of six major cancer types in rural population, 2004‐2018. ** P < 0.01, *** P < 0.001; + increased, –decreased from 2004 to 2018
