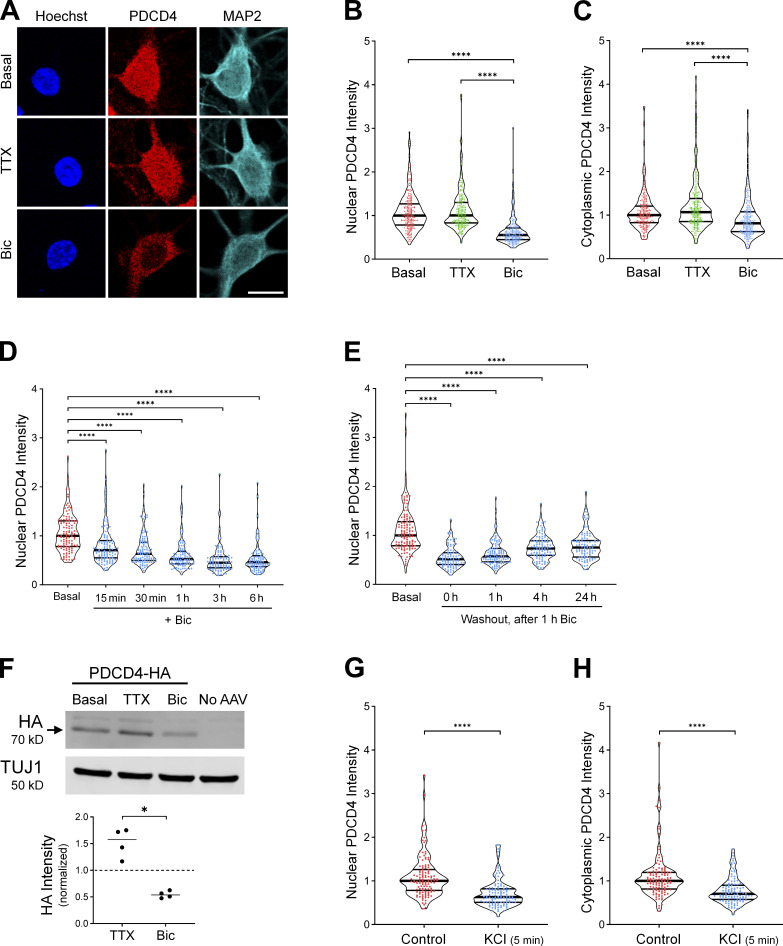
Figure 2.
Neuronal stimulation decreases PDCD4 protein concentration in the nucleus and cytoplasm of neurons. (A) PDCD4 ICC of basal, TTX-silenced, and Bic-stimulated neurons. Scale bar, 10 µm. (B) Violin plots of normalized nuclear PDCD4 ICC intensity. Basal, n = 226; TTX n = 227; and Bic n = 218 cells from 6 sets of cultures. Basal median = 1.00; TTX median = 1.00; Bic median = 0.55. Basal versus Bic, P < 0.0001; TTX versus Bic, P < 0.0001. (C) Violin plots of normalized cytoplasmic PDCD4 ICC intensity in the same cells as in B. Basal median = 1.00; TTX median = 1.07; Bic median = 0.81. Basal versus Bic, P < 0.0001; TTX versus Bic, P < 0.0001. (D) Violin plots of normalized nuclear PDCD4 ICC intensity after varying durations of Bic stimulation. Basal, n = 115; Bic 15 min, n = 111; Bic 30 min, n = 102; Bic 1 h, n = 97; Bic 3 h, n = 92; and Bic 6 h, n = 91 cells from three sets of cultures. Basal median = 1.00; Bic 15 min median = 0.71; Bic 30 min median = 0.63; Bic 1 h median = 0.52; Bic 3 h median = 0.45; Bic 6 h median = 0.46. Basal versus Bic 15 min, P < 0.0001; basal versus Bic 30 min, P < 0.0001; basal versus Bic 1 h, P < 0.0001; basal versus Bic 3 h, P < 0.0001; basal versus Bic 6 h, P < 0.0001. (E) Violin plots of normalized nuclear PDCD4 ICC intensity at various time points after removal of a 1-h Bic stimulation. Basal, n = 124; washout 0 h, n = 94; washout 1 h, n = 111; washout 4 h, n = 104; and washout 24 h, n = 99 cells from 3 sets of cultures. Basal median = 1.00; washout 0 h median = 0.51; washout 1 h median = 0.57; washout 4 h median = 0.73; washout 24 h median = 0.75. Basal versus 0 h, P < 0.0001; basal versus 1 h, P < 0.0001; basal versus 4 h, P < 0.0001; basal versus 24 h, P < 0.0001. (F) Top: Western blot of protein lysates from basal, TTX-silenced, and Bic-stimulated neurons transduced with PDCD4-HA AAV. The PDCD4-HA band is indicated with an arrow. We observed a faint nonspecific band above the HA band. Bottom: Quantification of Western blot from four sets of cultures. HA intensity was normalized to TUJ1 intensity. Within each experiment, all samples were normalized to the basal sample. TTX/basal median = 1.57; Bic/basal median = 0.54. TTX versus Bic, P = 0.0286. (G) Violin plots of normalized nuclear PDCD4 ICC intensity. Control n = 118 and KCl n = 110 cells from three sets of cultures. Control median = 1.00; KCl median = 0.63. Control versus KCl, P < 0.0001. (H) Violin plots of normalized cytoplasmic PDCD4 ICC intensity in the same cells as in G. Control median = 1.00; KCl median = 0.70. Control versus KCl, P < 0.0001. *, P < 0.05; ****, P < 0.0001; Mann-Whitney U test with Bonferroni correction.

