Figure 5.
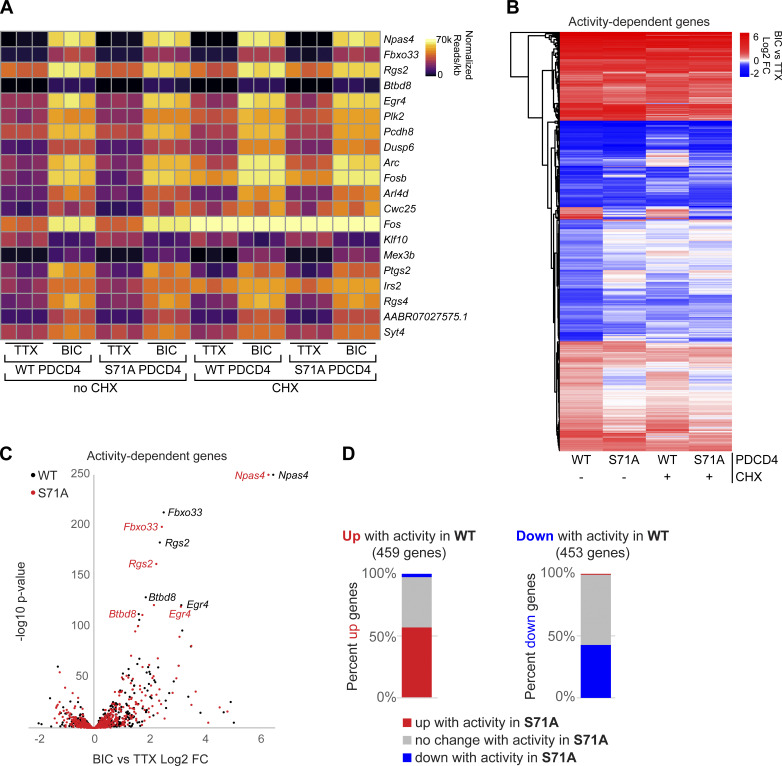
Stimulus-induced degradation of PDCD4 regulates the expression of neuronal activity–dependent genes. (A) For each biological replicate, normalized read counts (from DESeq2) divided by transcript length are shown for the top 20 activity-dependent genes, ranked by adjusted P value for PDCD4 WT no-CHX samples. Each row represents a gene, and each column represents a biological replicate. The color of each box indicates transcript abundance (note: color is not scaled linearly in order to display full range of read counts; see Table S3 for full dataset). (B) Stimulation-induced log2 FC for all 912 activity-dependent genes, clustered by FC across sample type. Each row represents a gene, and each column represents a sample type. The color legend represents Bic versus TTX log2 FC, with red representing up-regulation, blue representing down-regulation, and white indicating log2 FC of 0. (C) For each activity-dependent gene, Bic versus TTX log2 FC is plotted against −log10 of adjusted P value from PDCD4 WT samples (black) and PDCD4 S71A samples (red). Gene names for the top five activity-dependent genes by adjusted P value are labeled. For both PDCD4 WT and PDCD4 S71A samples, Npas4 Bic versus TTX adjusted P value was 0 (−log10 of 0 is not defined); therefore, for display, the −log10 adjusted P value for Npas4 was set to 250 for both samples. (D) Activity-dependent up-regulated genes (left bar) and activity-dependent down-regulated genes (right bar) were categorized by the activity-dependent differential expression in PDCD4 S71A samples. The colors in each bar show the percentage of activity-dependent genes showing activity-dependent up-regulation (red), no change (gray), or down-regulation (blue) in PDCD4 S71A samples.

