Figure 2.
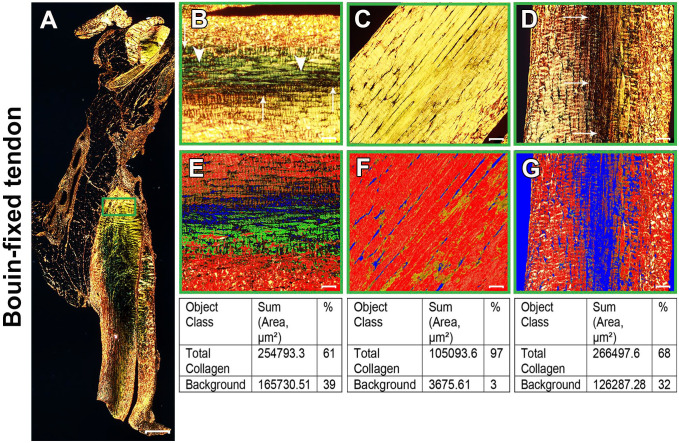
Bouin-fixed normal Achilles tendon stained with picrosirius red (PSR). (A) Polarized view of representative entire longitudinal Achilles tendon section. (B–D) Magnifications of approximately the same region as the green box in panel A at three different orientations: 0°(B), 45°(C), and 90°(D). At 0°(B), collagen fibers showed a mixture of birefringence with yellowish-orange and greenish-yellow (arrowheads). As the microscope stage was rotated, the birefringence of collagen changed gradually. At 45° (C), the tendon appeared uniformly bright yellow. At 90°(D), birefringence changed to yellowish-orange with more collagen fibers at extinction (arrows in B and D). (E–G) PSR images acquired in the same regions of interest as panels B–D were quantitatively compared for the percentage of total collagen using the Count & Measure module of the cellSens software. Blue indicates background; the sum of red and yellow is total collagen, represented as red in the quantification panel. Tendon overview image (A) was obtained with a 4× magnification lens (scale bar: 500 µm). Higher magnification images within the boxes (B–F) were obtained with a 20× magnification lens (scale bar: 50 µm).

