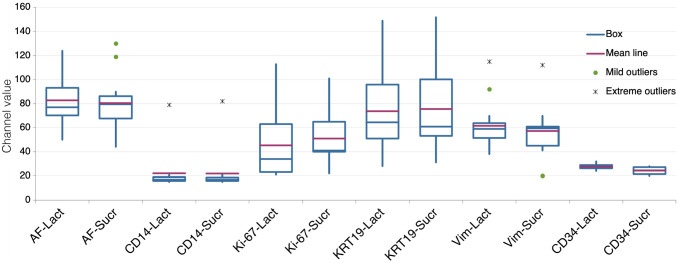
Figure 2.
Comparison of the effect of lactose or sucrose, added to the EDTA in the AR buffer. Variation in fluorescence intensity (expressed as channel value for 90% of the positive pixels) for each marker according to the two AR treatments: EDTA + Lactose (LACT) and EDTA + Sucrose (SUCR). Fourteen samples tested for each marker, except Ki-67 (13 samples) and CD34 (4 samples). Abbreviations: AR, antigen retrieval; AF, autofluorescence.

