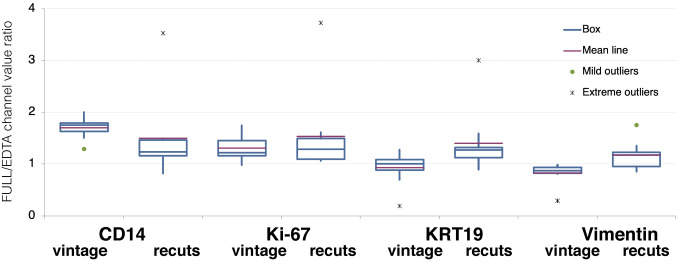
Figure 3.
Relative variation of fluorescence intensity by comparing EDTA vs FULL AR on vintage sections and recuts. The channel value for each marker shown after AR FULL, divided by the same value for EDTA, was calculated and plotted for vintage sections and for recuts. Analysis of variance shows p=0.006 significance overall, with the contribution of CD14 (p=0.04) and vimentin (p=0.03) on vintage sections. Between 8 and 10 samples per experimental point. Abbreviation: AR, antigen retrieval.

