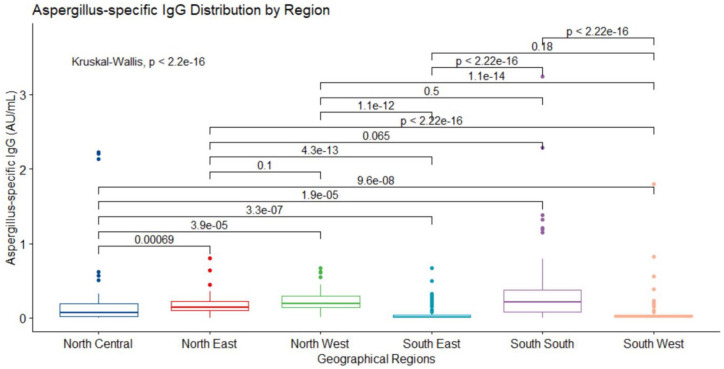
Figure 4.
IgG level stratified by geographical regions. Median (IQR) values in the regions are north central (NC) (n = 101 (19.5%), 0.07 (0.017–0.188)), north east (NE) (n = 51 (9.8%), 0.143 (0.103–0.227)), north west (NW) (n = 50 (9.6%), 0.189 (0.138–0.295)), south east (SE) (n = 53 (10.2%), 0.012 (0.005–0.035)), south south (SS) (n = 100 (19.3%), 0.215 (0.076–0.379)) and south west (SW) (n = 164 (13.6%), 0.018 (0.007–0.036)). Kruskal–Wallis rank sum test displayed differences in the median values (p < 0.0001) of IgG level across the regions. The Pairwise comparison of the medians using Wilcoxon rank sum test revealed significant differences between (NC – NE, p = 0.00069), (NC – NW, p < 0.0001), (NC – SE, p < 0.0001), (NC – SS, p < 0.0001), (NC – SW, p < 0.0001), (NE – SE, p < 0.0001), (NE – SW, p < 0.0001), (NW – SE, p < 0.0001), (NW – SW, p < 0.0001), (SE – SS, p < 0.0001) and (SS – SW, p < 0.0001). There were not statistically significant differences between (NE – NW, p = 0.1), (NE – SS, p = 0.065), (NW – SS, p = 0.5) and (SE – SW, p = 0.18).

