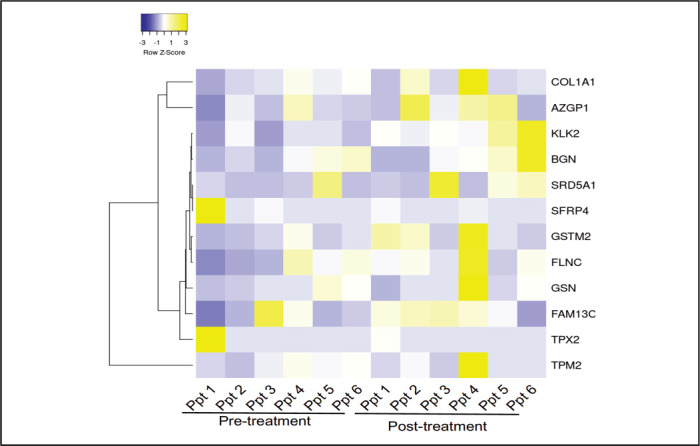
Figure 3.

Heatmap Illustrating Differences in the 12-Transcript Expression Among the Six Participants. Cluster analysis of RT-PCR data profiling in six participants. Each row represents one of the 12 transcripts present in Oncotype Dx Prostate Cancer test and each column a participant. The scale represents standard deviations from the mean after a Z-transformation of signal values of a gene across all samples. Yellow represents a higher level of gene expression and blue a lower level, relative to the mean across all samples for each gene.
