Abstract
Background
Immune checkpoint (IC) blockades (ICBs) significantly improve patients’ clinical outcomes with solid tumors. Because the objective response rate of single-agent ICB is limited, it is meaningful to explore the combination of ICs for immunotherapy.
Methods
RNA sequencing data of 95 newly diagnosed patients with esophageal squamous cell carcinoma (ESCC) from The Cancer Genome Atlas (TCGA) database were used to explore the prognostic significance of ICs. The results were validated by immunohistochemistry of 58 ESCC tissue samples from our clinical center.
Results
The results of both TCGA and validation data suggested that high expression of programmed cell death 1 ligand 1 (PD-L1), T-cell immunoglobulin and mucin-domain-containing-3 (TIM3), and T-cell immunoglobulin and immunoreceptor tyrosine-based inhibitory motif domain (TIGIT) was associated with poor overall survival (OS) of patients with ESCC. Importantly, PD-L1/TIM3 or PD-L1/TIGIT was the optimal combination for predicting poor OS and short restricted mean survival time of patients with ESCC and was an independent prognostic factor. Moreover, a nomogram model constructed by PD-L1, TIM3, and TIGIT together with the primary tumor, regional lymph node, distant metastasis stage could provide a concise and precise prediction of 1-year and 2-year OS rates and median survival time. PD-L1/TIM3 or PD-L1/TIGIT had a positive correlation with CD8+ T cells. Notably, PD-1 and TIM3/TIGIT were primarily coexpressed on CD8+ tumor-infiltrating lymphocyte in patients with ESCC by multiplexed immunofluorescence.
Conclusion
High expression of ICs was associated with poor OS of patients with ESCC. PD-L1/TIM3 and PD-L1/TIGIT were the optimal combinations for predicting OS, which might be potential targets for future ICBs therapy of ESCC.
Keywords: costimulatory and inhibitory T-cell receptors, immunity, immunohistochemistry, tumor biomarkers
Introduction
Esophageal cancer is one of the most common gastrointestinal cancers globally.1 2 Esophageal squamous cell carcinoma (ESCC) accounts for approximately 90% of esophageal cancers, often at an advanced stage when initially diagnosed.3 4 Even with multimodality treatments (surgery, radiotherapy, chemotherapy, and targeted therapy), the prognosis of patients with ESCC remains unfavorable, with a 5-year survival≤50%.5 Therefore, there is an urgent need to develop new treatment strategies to improve the outcome of patients with ESCC.
In recent years, immunotherapy with immune checkpoint (IC) blockades (ICBs) has shown promising effects in patients with solid tumors.6 7 The expression of ICs will lead to tumor cells’ immune escape, promoting tumor progression.8 ICBs can significantly improve the outcome of patients by targeting ICs, including the programmed cell death 1 (PD-1)/PD-1 ligand 1 (PD-L1) axis.4 9 New ICs, such as T-cell immunoglobulin and mucin-domain-containing-3 (TIM3) and T-cell immunoglobulin and immunoreceptor tyrosine-based inhibitory motif domain (TIGIT), are emerging immune targets in patients with ESCC.10 11 For current anti-PD-1/PD-L1 antibodies, the objective response rate is limited, ranging from 6.4% to 33.3%.4 9 12 This may be due to the heterogeneity of expression patterns of ICs in patients with ESCC. Therefore, it is meaningful to systematically investigate the expression patterns of ICs so that more patients with ESCC can benefit from ICBs.
In this study, we investigated the expression patterns of ICs and their impact on ESCC patients’ prognosis by analyzing the RNA-seq dataset from The Cancer Genome Atlas (TCGA) database and immunohistochemistry (IHC) of tissue samples from our clinical center. Then, the correlation between ICs and CD4+ and CD8+ tumor-infiltrating lymphocytes (TILs) was explored.
Materials and methods
TCGA dataset
The level 3 RNA sequencing data of 95 newly diagnosed patients with ESCC from the TCGA database (https://cancergenome.nih.gov/) were acquired by the UCSC Xena platform (https://xenabrowser.net/datapages/), which was designated as a training cohort. Related clinical information, including age, gender, primary tumor, regional lymph node, distant metastasis (TNM) stage, survival time, and status, were also obtained, listed in online supplemental table S1. The ESCC dataset in the TCGA database was publicly available and therefore no approval from the local ethics committee was required.
jitc-2021-002836supp001.pdf (14.3KB, pdf)
ESCC tissue samples
Formalin- fixed, paraffin-embedded (FFPE) blocks were collected from 58 ESCC patients treated with pathological tumor biopsy or surgical resection at the Second Affiliated Hospital of South China University of Technology between December 1, 2012 and December 31, 2019, was assigned as a validation cohort. Patients with autoimmune diseases or other esophageal cancers (eg, adenocarcinoma) were excluded. All biopsy samples were obtained before chemotherapy or radiation therapy. According to the Union for International Cancer Control and the American Joint Committee on Cancer 8th staging system, tumors were staged. The last follow-up was conducted on February 21, 2021, and the median follow-up time was 397 days (range: 18–1517 days). The clinical information is shown in online supplemental table S1. The key inclusion criteria in training and validation cohorts were as follows: (1) Newly diagnosed patients with cytopathological confirmed ESCC and (2) aged 18 years or older. Major exclusion criteria were as follows: (1) Prior treatments of chemotherapy, targeted therapy, radiotherapy, or surgery and (2) no complete follow-up information.
Immunohistochemistry
Tissue slides (4 µm thickness) were prepared from FFPE samples, deparaffinized, and rehydrated through graded ethanol. Then, the slides were boiled in ethylenediaminetetraacetic (EDTA) (1 mM, pH 8.0) buffer in a microwave oven for antigen retrieval. The endogenous peroxidase activity was quenched by using 0.3% H2O2 and the non-specific binding was blocked by incubating in 5% goat serum. After this, the slides were incubated with the primary antibodies: rabbit anti-human PD-L1 (Abcam, ab205921, 1:200), rabbit anti-human TIGIT (Abcam, ab243903, 1:200), rabbit anti-human TIM3 (Abcam, ab185703, 1:400), and rabbit anti-human CD8 (Abcam, ab4055, 1:200). Then, the slides were incubated with corresponding horseradish peroxidase (HRP)-conjugated secondary antibody (DAKO EnVision Detection Kit) and visualized using the diaminobenzidine solution in the DAKO Kit. After hematoxylin counterstaining, the slides were dehydrated and sealed. The slides with immunoreactivity were scored by five randomly and averagely selected high-power fields. The scoring rules were as follows: 0, negative/trace level of staining (<5% cells are positive); 1+, weak staining (>5% cells but <25% are positive but stained with weak intensity); 2+, moderate staining (>25% cells but <50% are positive and stained with moderate intensity); and 3+, intense staining (>50% cells are positive and stained with vigorous intensity), respectively. The H-score was the multiplication of staining intensity and staining range. The cells with immunoreactivity scores of 0 were classified as negative; other scores were positive. PD-L1 analysis was performed using the combined positive score, that was, the number of PD-L1 staining cells (tumor cells and infiltrating leucocytes) divided by the total number of viable tumor cells, then multiplied by 100. For the other immunohistochemical markers, positive cells were evaluated by infiltrating leucocytes.
Multiplexed immunofluorescence
For immunofluorescence staining, the slides are deparaffinized and rehydrated with graded ethanol and the process of antigen retrieval and non-specific binding blocking is the same as the previous IHC.
For the multiplexed immunofluorescence of CD4, CD8, PD-1, TIM3, TIGIT, and DAPI (for nuclear staining) in the FFPE tissue, we used a validated multiple fluorescence staining kit from Servicebio (Wuhan, China), according to the manufacturer’s recommendation. The following primary antibodies were used: mouse anti-human PD-1 (Abcam, ab52587, 1:200), rabbit anti-human TIGIT (Abcam, ab243903, 1:200), rabbit anti-human TIM3 (Abcam, ab185703, 1:400), and rabbit anti-human CD8 (Abcam, ab4055, 1:200). After the slides are incubated with each primary antibody and the corresponding HRP-labeled secondary antibody, the slides need to be labeled with different fluorescent dyes. The sample scanning, spectral unmixing, and quantification of signals were conducted with the panoramic MIDI Pathology Imaging System, using the CaseViewer V.2.3 software of 3DHISTECH.
Construction of nomogram model
For the prognostic model in this study, we referred to the reporting recommendations for tumor marker prognostic studies and our previous report on constructing a nomogram model for predicting the prognosis of patients with cancer.13–16 The nomogram model for predicting overall survival (OS) rate and median survival time of patients with ESCC was constructed by ‘foreign’ and ‘rms’ packages in R (V.4.0.2, https://www.r-project.org/).13 14 The internal and external calibration curves, through 1000 sample bootstrap, were applied to validate the nomogram model’s performance in evaluating prognosis. The evaluation criteria for the nomogram’s prediction performance were as follows: the predicted value of the calibration curve was around the ideal line. The area under the curve (AUC) of the time-dependent receiver operating characteristic (ROC) curve was higher than 0.5.
Statistical analysis
Statistical analysis was conducted by R language (V.4.0.2, https://www.r-project.org/) and SPSS software (V.22.0, IBM, Armonk, New York, USA), as appropriate. The ‘surv_cutpoint’ function in the ‘survminer’ package was used to determine the optimal cut-off values of ICs (online supplemental figure S1)17 and a log-rank test was used to compare differences between Kaplan-Meier curves. The Spearman correlation coefficient expressed the relationship between the two ICs. The correlation between the two sets of qualitative data was shown by Cramer’s V.18 The qualitative data were compared by χ2 and Fisher test, as appropriate. Comparison of quantitative data between two and multiple groups was performed by Mann-Whitney-Wilcoxon test and Kruskal-Wallis test, respectively. A two-tailed p value<0.05 was defined as statistically significant.
jitc-2021-002836supp002.pdf (32.5KB, pdf)
jitc-2021-002836supp003.pdf (482.4KB, pdf)
Results
OS analysis of ICs in patients with ESCC
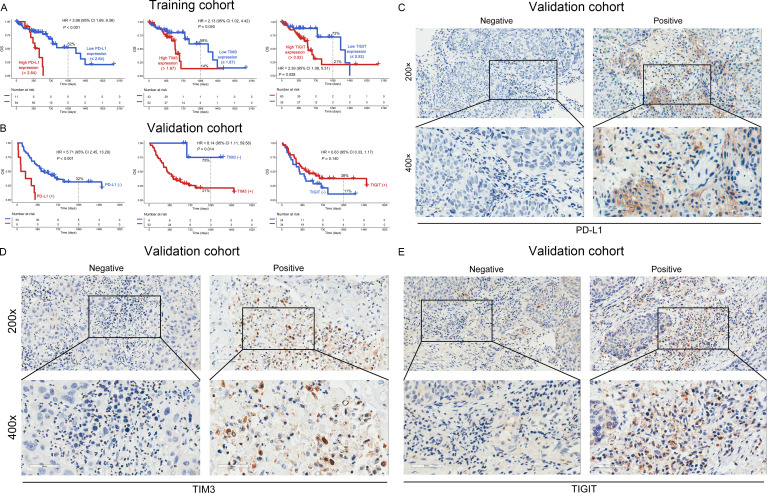
A total of 95 newly diagnosed patients with ESCC from the TCGA database were analyzed (figure 1). High mRNA expression of PD-L1 (0% vs 52%, p<0.001), TIM3 (14% vs 59%, p=0.040), and TIGIT (21% vs 72%, p=0.028) was associated with poor 3-year OS (figure 2A). However, the mRNA expression levels of PD-1, PD-L2, cytotoxic T-lymphocyte associated protein 4 (CTLA4), lymphocyte activation gene-3, and B and T lymphocyte associated were not significantly correlated with OS (p>0.05, online supplemental figure S2A–E). Notably, the expression level of mRNA does not always match the protein; therefore, we analyzed the prognostic importance of mRNA expression and protein expression in patients with ESCC. Then, we performed IHC to detect the protein expression in the validation cohort (figure 2C–E). Poor 3-year OS was observed in patients with PD-L1 (+) or TIM3 (+) (0% vs 32%, p<0.001 and 21% vs 75%, p=0.014, respectively), but not in those with TIGIT (+) (p=0.140, figure 2B).
Figure 1.
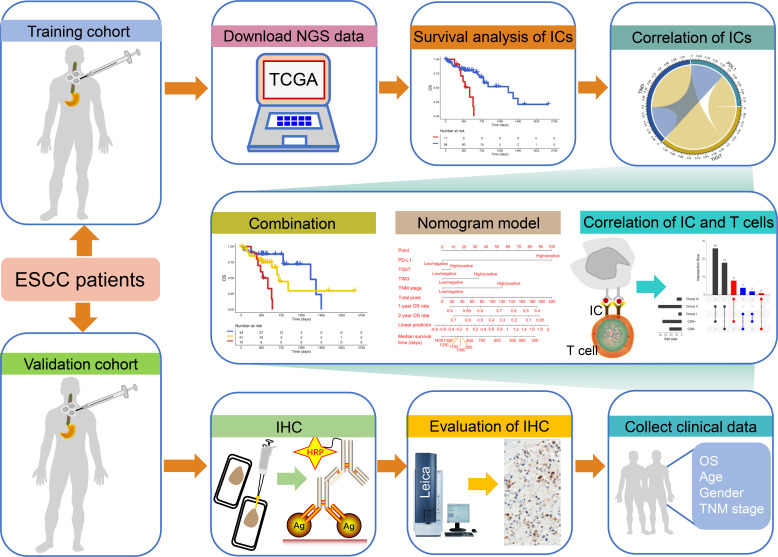
Study schematics. The next-generation sequencing (NGS) data of esophageal squamous cell carcinoma (ESCC) patients from The Cancer Genome Atlas database and the immunohistochemistry (IHC) data from our clinical center were assigned as training and validation cohorts. Patients with ESCC in training and validation cohorts were not treated with immune checkpoint (IC) inhibitors. We first explored the impact of ICs on the overall survival (OS) and the correlation between ICs. Then, the effect of the combination of ICs on the prognosis of ESCC and the visualization of OS rate and survival by nomogram model were further investigated. Finally, the relationship between ICs and T cells was explored. HRP, horseradish peroxidase; TNM, primary tumor, regional lymph node, distant metastasis.
Figure 2.
OS analysis of ICs in the training and validation cohorts. The mRNA and protein expression levels of PD-L1 (left panel), TIM3 (middle panel), and TIGIT (right panel) had an impact on the OS rate of patients with ESCC in the training (A) and validation (B) cohorts. Representative micrographs of PD-L1 (C), TIM3 (D), and TIGIT (E) protein expression within the tumor tissue. ESCC, esophageal squamous cell carcinoma; ICs, immune checkpoints; OS, overall survival; PD-L1, programmed cell death 1 ligand 1; TIGIT, T-cell immunoglobulin and immunoreceptor tyrosine-based inhibitory motif domain; TIM3, T-cell immunoglobulin and mucin-domain-containing-3.
jitc-2021-002836supp004.pdf (442.8KB, pdf)
Increased coexpression of ICs was associated with poor OS
To further investigate the coexpression relationship between ICs, we performed Spearman correlation analysis. In the training cohort, there was a significant positive correlation between them (PD-L1/TIM3, R=0.39; PD-L1/TIGIT, R=0.39; TIM3/TIGIT, R=0.72; p<0.001; online supplemental figure S3A). We analyzed the coexpression pattern and found that the paired combination of mRNA PD-L1, TIM3, and TIGIT was significantly associated with poor OS (PD-L1/TIM3, p<0.001; PD-L1/TIGIT, p<0.001; TIM3/TIGIT, p=0.015; figure 3A, B and online supplemental figure S3B).
Figure 3.
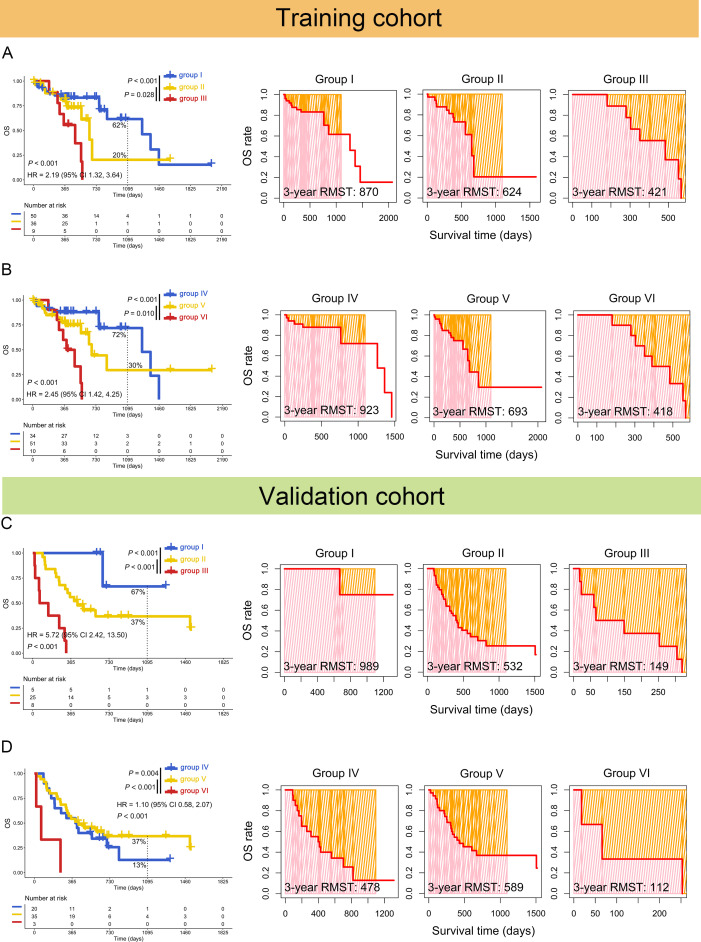
Increased coexpression of PD-L1/TIM3 or PD-L1/TIGIT predicted poor OS of patients with ESCC. Kaplan-Meier (left panel) and restricted mean survival time (RMST) (right panel) curves were plotted based on the different groups of mRNA PD-L1/TIM3 (A) or PD-L1/TIGIT (B) in the training cohorts. The results of Kaplan-Meier (left panel) and RMST (right panel) curves of protein PD-L1/TIM3 (C) or PD-L1/TIGIT (D) were confirmed in the validation cohorts. Group I: PD-L1loTIM3lo or PD-L1 (−)/TIM3 (−); group II: PD-L1hiTIM3lo or PD-L1loTIM3hi, PD-L1 (+)/TIM3 (−) or PD-L1 (−)/TIM3 (+); group III: PD-L1hiTIM3hi or PD-L1 (+)/TIM3 (+); group IV: PD-L1loTIGITlo or PD-L1 (−)/TIGIT (−); group V: PD-L1hiTIGITlo or PD-L1loTIGIThi, PD-L1 (+)/TIGIT (−) or PD-L1 (−)/TIGIT (+); and group VI: PD-L1hiTIGIThi or PD-L1 (+)/TIGIT (+). ESCC, esophageal squamous cell carcinoma; OS, overall survival; PD-L1, programmed cell death 1 ligand 1; TIGIT, T-cell immunoglobulin and immunoreceptor tyrosine-based inhibitory motif domain; TIM3, T-cell immunoglobulin and mucin-domain-containing-3.
jitc-2021-002836supp005.pdf (453.1KB, pdf)
Then, the optimal ICs combination was further investigated. The concomitant high mRNA expressions of PD-L1/TIM3 (0% vs 20%, 421 vs 624 days, p=0.028) or PD-L1/TIGIT (0% vs 30%, 418 vs 693 days, p=0.01) was associated with poor 3-year OS rate and restricted mean survival time (RMST), compared with high mRNA expression of single marker (figure 3A, B). The combination of TIGIT/TIM3 had no such effects (13% vs 35%, p=0.430, online supplemental figure S3B).
These results were confirmed in the validation cohort. The positive protein expression of dual PD-L1/TIM3 (0% vs 37%, 149 vs 532 days, p<0.001) or PD-L1/TIGIT (0% vs 37%, 112 vs 589 days, p<0.001) was related to worse 3-year OS rate and RMST (figure 3C, D) than single one. Both mRNA PD-L1/TIM3 (HR=4.40, 95% CI: 1.55 to 12.51, p=0.005) and PD-L1/TIGIT (HR=4.78, 95% CI: 1.63 to 13.96, p=0.004) were found to be independent prognostic factors (table 1). These results were again confirmed in the validation cohort (PD-L1/TIM3: HR=47.11, 95% CI: 5.34 to 415.96, p=0.001; PD-L1/TIGIT: HR=25.18, 95% CI: 3.34 to 189.74, p=0.002, table 2).
Table 1.
Univariate and multivariate regression analysis of mRNA PD-L1/TIM3 and PD-L1/TIGIT in the training cohort
| Variables | Multivariate regression | |||||
| Univariate regression | PD-L1/TIM3 | PD-L1/TIGIT | ||||
| HR (95% CI) | P value | HR (95% CI) | P value | HR (95% CI) | P value | |
| PD-L1/TIM3 | ||||||
| Group I | reference | reference | ||||
| Group II | 1.79 (0.78 to 4.11) | 0.166 | 1.42 (0.57 to 3.51) | 0.450 | ||
| Group III | 5.09 (1.89 to 13.67) | 0.001 | 4.40 (1.55 to 12.51) | 0.005 | ||
| PD-L1/TIGIT | ||||||
| Group IV | reference | reference | ||||
| Group V | 1.86 (0.79 to 4.36) | 0.155 | 1.43 (0.57 to 3.60) | 0.449 | ||
| Group VI | 6.16 (2.18 to 17.37) | 0.001 | 4.78 (1.63 to 13.96) | 0.004 | ||
| Age, years | 1.04 (1.00 to 1.07) | 0.052 | ||||
| Gender | ||||||
| Female | reference | reference | reference | |||
| Male | 5.27 (1.22 to 22.71) | 0.026 | 3.03 (0.65 to 14. 02) | 0.157 | 3.49 (0.77 to 15.91) | 0.106 |
| TNM stage | ||||||
| Low (I, II) | reference | reference | reference | |||
| High (III, IV) | 2.39 (1.17 to 4.90) | 0.017 | 1.75 (0.81 to 3.77) | 0.155 | 1.59 (0.72 to 3.50) | 0.248 |
Group I, PD-L1loTIM3lo; group II, PD-L1hiTIM3lo or PD-L1loTIM3hi; group III, PD-L1hiTIM3hi; group IV, PD-L1loTIGITlo; group V, PD-L1hiTIGITlo or PD-L1loTIGIThi; and group VI, PD-L1hiTIGIThi.
The bold values indicate that p values <0.05 in PD-L1/TIM3 and PD-L1/TIGIT are statistically significant.
CI, confidence interval; HR, hazard ratio; PD-L1, programmed cell death 1 ligand 1; TIGIT, T-cell immunoglobulin and immunoreceptor tyrosine-based inhibitory motif domain; TIM3, T-cell immunoglobulin and mucin-domain-containing-3; TNM, primary tumor, regional lymph node, distant metastasis.
Table 2.
Univariate and multivariate regression analysis of protein PD-L1/TIM3 and PD-L1/TIGIT in the validation cohort
| Variables | Multivariate regression | |||||
| Univariate regression | PD-L1/TIM3 | PD-L1/TIGIT | ||||
| HR (95% CI) | P value | HR (95% CI) | P value | HR (95% CI) | P value | |
| PD-L1/TIM3 | ||||||
| Group I | reference | reference | ||||
| Group II | 7.16 (0.97 to 52.75) | 0.053 | 8.56 (1.14 to 64.30) | 0.037 | ||
| Group III | 35.81 (4.27 to 300.18) | 0.001 | 47.11 (5.34 to 415.96) | 0.001 | ||
| PD-L1/TIGIT | ||||||
| Group IV | reference | reference | ||||
| Group V | 0.74 (0.38 to 1.44) | 0.380 | 0.59 (0.29 to 1.20) | 0.143 | ||
| Group VI | 5.74 (1.58 to 20.90) | 0.008 | 25.18 (3.34 to 189.74) | 0.002 | ||
| Age, years | 0.60(0.32 to 1.12) | 0.107 | ||||
| Gender | ||||||
| Female | reference | |||||
| Male | 1.59 (0.49 to 5.22) | 0.441 | ||||
| TNM stage | ||||||
| Low (I, II) | reference | reference | reference | |||
| High (III, IV) | 2.26 (1.02 to 5.03) | 0.046 | 2.36 (1.02 to 5.44) | 0.044 | 2.26 (1.00 to 5.10) | 0.049 |
Group I, PD-L1 (−)/TIM3 (−); group II, PD-L1 (+)/TIM3 (−) or PD-L1 (−)/TIM3 (+); group III, PD-L1 (+)/TIM3 (+); group IV, PD-L1 (−)/TIGIT (−); group V, PD-L1 (+)/TIGIT (−) or PD-L1 (−)/TIGIT (+); and group VI, PD-L1 (+)/TIGIT (+).
The bold values indicate that p values <0.1 in PD-L1/TIM3 and PD-L1/TIGIT are statistically significant.
PD-L1, programmed cell death 1 ligand 1; TIGIT, T-cell immunoglobulin and immunoreceptor tyrosine-based inhibitory motif domain; TIM3, T-cell immunoglobulin and mucin-domain-containing-3; TNM, primary tumor, regional lymph node, distant metastasis.
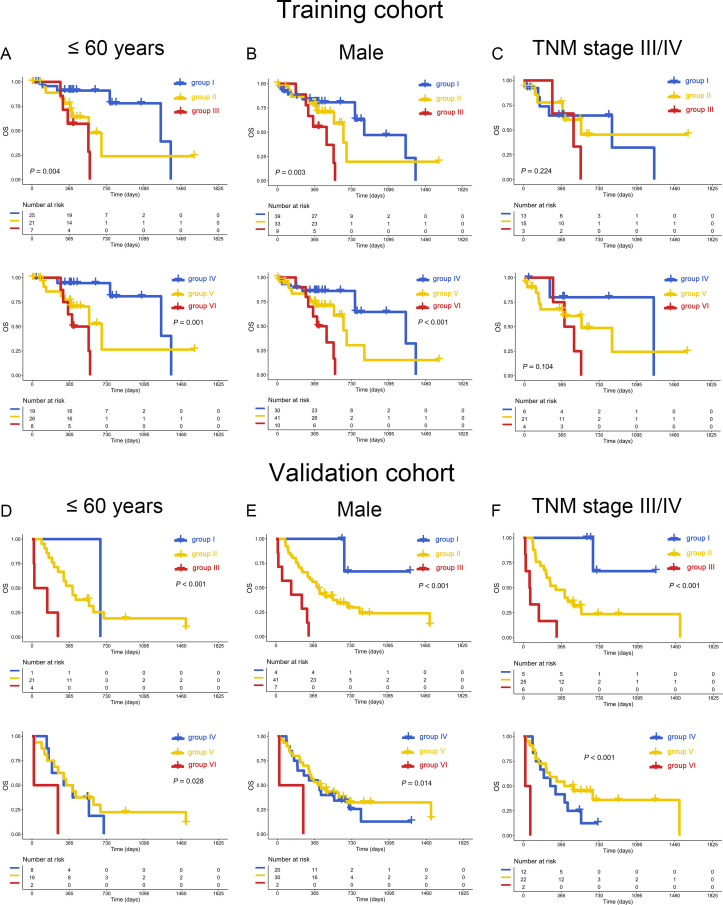
Subgroup analysis suggested that the unfavorable influence of high expression of PD-L1/TIM3 was restricted in young (≤60 y) and male patients (p=0.004 and 0.003 in the training cohort, p<0.001 in the validation cohort). Similar results can be found in PD-L1/TIGIT (p=0.001 and p<0.001 in training cohort, p=0.028 and 0.014 in validation cohort, figure 4A, B, D, E). However, in patients either old (>60 y) or female, this influence was not significant (p>0.05, online supplemental figure S4 A, B, D, E).
Figure 4.
Subgroup analysis of PD-L1/TIM3 and PD-L1/TIGIT. Coexpression of mRNA PD-L1/TIM3 (upper panel) or PD-L1/TIGIT (bottom panel) was associated with poor OS of patients with ESCC younger than 60 years (A), males (B), or TNM stage III/IV (C) in the training cohort. The impact of protein PD-L1/TIM3 (upper panel) or PD-L1/TIGIT (bottom panel) on OS of patients with ESCC younger than 60 years (D), males (E), or TNM stage III/IV (F) in the validation cohort. ESCC, esophageal squamous cell carcinoma; OS, overall survival; PD-L1, programmed cell death 1 ligand 1; TIGIT; T-cell immunoglobulin and immunoreceptor tyrosine-based inhibitory motif domain; TIM3, T-cell immunoglobulin and mucin-domain-containing-3; TNM, primary tumor, regional lymph node, distant metastasis.
jitc-2021-002836supp007.pdf (535.3KB, pdf)
Construction of a nomogram model
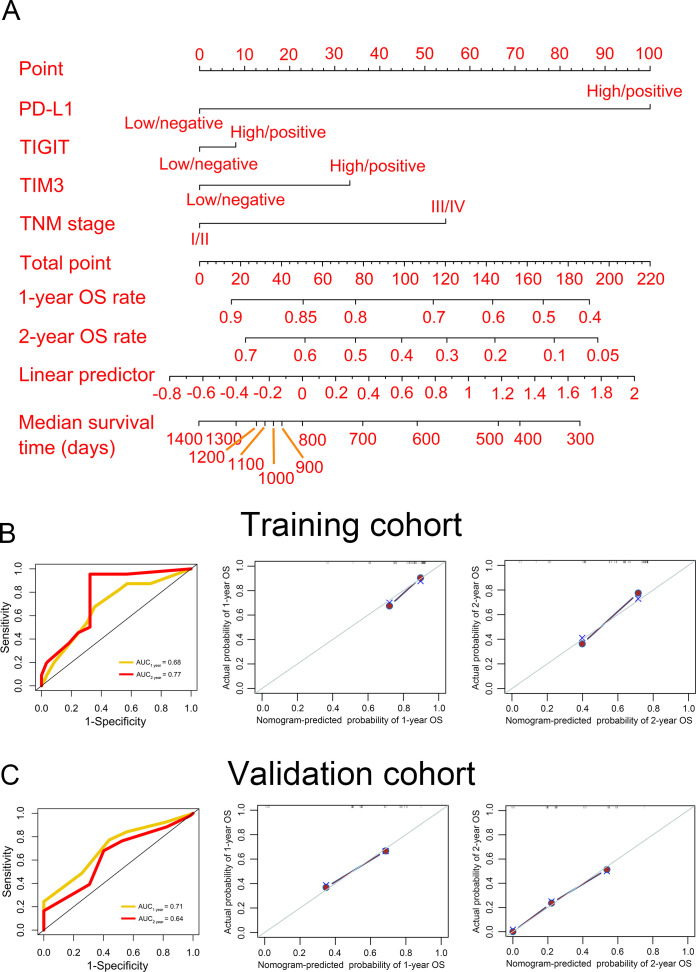
We first performed univariate and multivariate analysis for prognostic factors. We found that in addition to PD-L1/TIM3 and PD-L1/TIGIT, the TNM stage was also an independent predictor in the validation cohort (HR >1, p<0.05, table 2). Thereafter, PD-L1, TIM3, TIGIT, and TNM stages were used to construct a nomogram model for predicting OS (figure 5A). The point of each variable, total points, and the corresponding survival rates were listed in online supplemental table S2. The time-dependent ROC curves in both the training and validation cohorts were used to evaluate the nomogram model, indicating that the nomogram model had a good performance (AUC>0.6, figure 5B, C, left panel). Furthermore, the internal and external calibration curves confirmed that the predicted OS was around the ideal line (figure 5B, C, middle and right panel).
Figure 5.
Establishment of nomogram model. (A) A nomogram model was constructed to predict the 1-year and 2-year OS rate and median survival time of patients with ESCC. The time-dependent receiver operating characteristic (left panel) and calibration (middle and right panels) curves were used to evaluate the performance of the nomogram model in the training (B) and validation (C) cohorts. AUC, area under the curve; OS, overall survival; PD-L1, programmed cell death 1 ligand 1; TIGIT, T-cell immunoglobulin and immunoreceptor tyrosine-based inhibitory motif domain; TIM3, T-cell immunoglobulin and mucin-domain-containing-3; TNM, primary tumor, regional lymph node, distant metastasis.
jitc-2021-002836supp006.pdf (11KB, pdf)
Relationship between PD-L1/TIM3 or PD-L1/TIGIT coexpression and the infiltration of CD4+/CD8+ TILs in ESCC
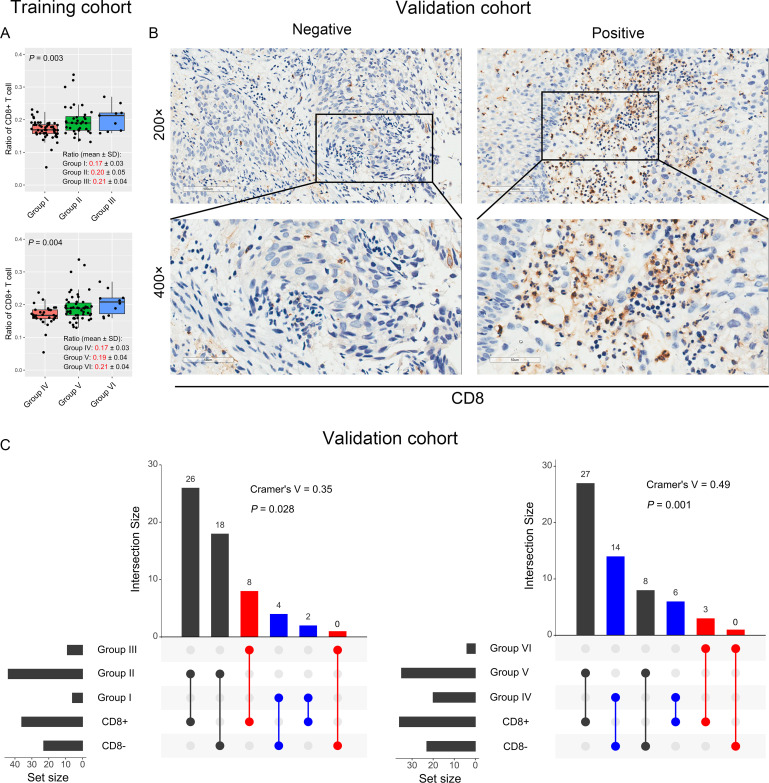
Regarding the complex interactions among the immune microenvironment, we analyzed the correlation between PD-L1, TIM3, TIGIT, and CD4+ or CD8+ TILs (figure 1). PD-L1/TIM3 and PD-L1/TIGIT were positively correlated with CD8+TIL in the training cohort (figure 6A). However, although the ratio of CD4+TIL was different among different PD-L1/TIM3 groups, this ratio in the PD-L1hiTIM3hi group was not higher than those in the PD-L1hi or TIM3hi group (ratio: 0.14 vs 0.15 vs 0.12, p=0.057, online supplemental figure S5A). Similar finding was also observed for PD-L1/TIGIT (ratio: 0.14 vs 0.15 vs 0.11, p=0.004, online supplemental figure S5B). To validate these findings, we performed IHC to detect CD8 protein expression in ESCC tissues (figure 6B). As expected, PD-L1/TIM3 and PD-L1/TIGIT each had a positive correlation with CD8 protein expression (Cramer’s V=0.35, p=0.028; Cramer’s V=0.49, p=0.001, respectively) (figure 6C). We further investigated the impact of CD4 and CD8 expression on OS in patients with ESCC and the results suggested that CD4 expression was not significantly correlated with OS (p=0.270, online supplemental figure S6A). Notably, high expression of CD8 was significantly associated with poor OS in the training cohort (HR=2.32, 95% CI: 1.00 to 5.37, p=0.043), though it was not statistically significant in the validation cohort (p=0.397) (online supplemental figure S6B, C).
Figure 6.
The relationship between PD-L1/TIM3 or PD-L1/TIGIT and CD8+ T cells. (A) The ratio of CD8+ T cells in different groups of PD-L1/TIM3 (upper panel) or PD-L1/TIGIT (bottom panel) in the training cohorts. The CD4+ and CD8+ T cells ratio in each patient was obtained from the TIMER database (http://cistrome.org/TIMER/). (B) Representative micrographs of CD8 protein expression within the tumor. (C) Evaluation of the relationship between PD-L1/TIM3 (left panel) or PD-L1/TIGIT (right panel) and CD8+ T cells by Cramer’s V of χ2 test in the validation cohort. PD-L1, programmed cell death 1 ligand 1; TIGIT, T-cell immunoglobulin and immunoreceptor tyrosine-based inhibitory motif domain; TIM3, T-cell immunoglobulin and mucin-domain-containing-3.
jitc-2021-002836supp008.pdf (194.6KB, pdf)
jitc-2021-002836supp009.pdf (447.9KB, pdf)
Coexpression of PD-1 and TIM3/TIGIT were detected on CD4+ and CD8+ TILs
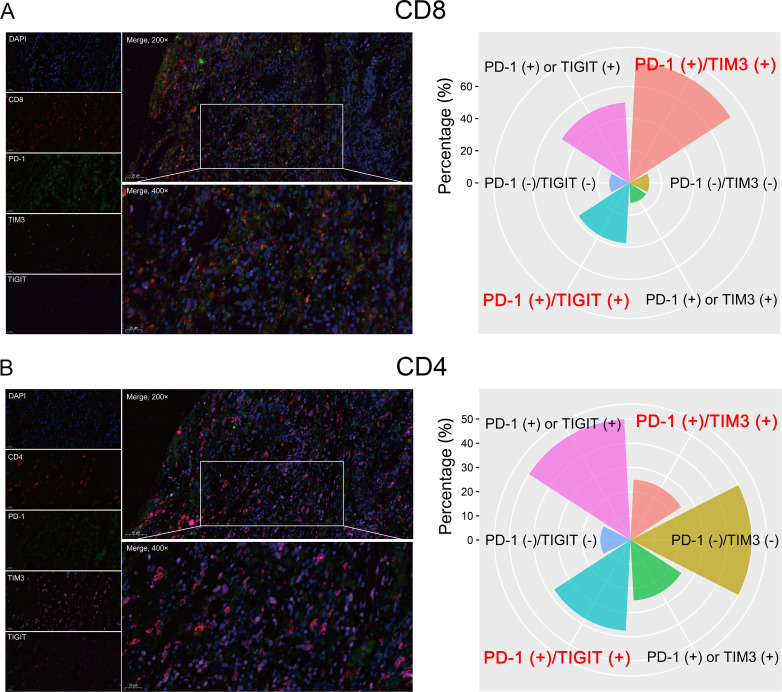
PD-1 is the receptor of PD-L1 and is a biomarker of T-cell exhaustion in various cancers. Furthermore, high PD-1 expression appeared to be correlated with poor OS for patients with ESCC in the training cohort, though the data were not yet significant enough at this point (p=0.055, online supplemental figure S2A). Therefore, we further explored the coexpression pattern of PD-1 and TIM3/TIGIT on CD4+ and CD8+ TILs in eight ESCC patients with high PD-L1 protein expression by multiplexed immunofluorescence in the validation cohort. Interestingly, the percentages of PD-1 and TIM3/TIGIT coexpression on CD8+ TIL were 75% (6/8) and 37.5% (3/8), respectively (figure 7A). However, the percentages of PD-1 and TIM3/TIGIT coexpression on CD4+ TIL were only 25% (2/8) and 37.5% (3/8), respectively (figure 7B). Herein, PD-1 and TIM3/TIGIT were primarily coexpressed on CD8+ TIL in patients with ESCC.
Figure 7.
Detection of PD-1 and TIM3/TIGIT expression on CD8+ (A) and CD4+ (B) cells by multiplexed immunofluorescence. A representative figure shows the expression of CD4, CD8, PD1, TIM3, and TIGIT in a patient with ESCC (left panel). The percentage of PD-1 and TIM3/TIGIT coexpression on CD8+ and CD4+ cells in patients with ESCC (right panel). ESCC, esophageal squamous cell carcinoma; PD-1, programmed cell death 1; TIGIT, T-cell immunoglobulin and immunoreceptor tyrosine-based inhibitory motif domain; TIM3, T-cell immunoglobulin and mucin-domain-containing-3.
Discussion
Esophageal cancer is an aggressive disease with a poor prognosis. ESCC and esophageal adenocarcinoma are two main histological subtypes. In China, most patients suffer from ESCC. The effects of conventional therapies, including surgery, chemotherapy, and radiotherapy, are unsatisfactory,19 novel treatments are urgently needed. In recent years, novel prognostic factors of patients with cancer have emerged, especially immune-related gene signatures.14 17 Immunotherapy with ICBs is promising for ESCC treatment, but how to screen the beneficiaries is still an important issue that needs to be explored.4
PD-L1 expression is one of the most useful predictive biomarkers for ICBs and PD-L1 blockade is established as standard of care in patients with ESCC.4 20 Another checkpoint, TIM3, suppresses antitumor immunity by mediating T-cell exhaustion. It serves as a promising target for cancer immunotherapy.21 Additionally, the TIGIT pathway can regulate T-cell-mediated tumor recognition and clinical trials for TIGIT antibodies are ongoing.22 All are potential immunotherapy targets; however, the integrative expression and predictive values of these checkpoints are little known. In this study, 95 patients with ESCC from the TCGA database and 58 tissue samples were used for OS analysis and validation. Patients with higher expression of PD-L1, TIM3, and TIGIT had a lower OS rate. Our results support the development of inhibitors against these targets in ESCC treatment.
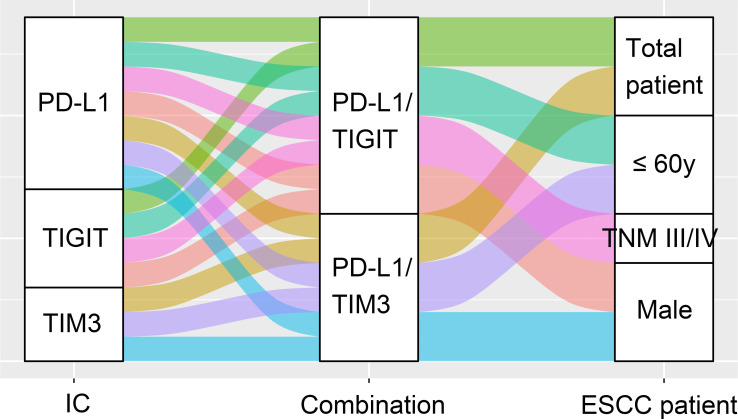
In this study, we found PD-L1 was positively associated with either TIM3 or TIGIT. Coexpression of PD-L1/TIM3 or PD-L1/TIGIT was closely related to the poor OS in patients with ESCCs, especially those with males, younger than 60 years, and TNM III/IV, and either combination was independently prognostic (figure 8). Our nomogram model constructed by PD-L1, TIM3, TIGIT, and TNM stages concisely and precisely predicted ESCC patients’ prognosis. These findings suggested the combination of PD-L1/TIM3 or PD-L1/TIGIT as immune biomarkers and also targeted for ICB therapy. In support of our viewpoint, the coexpression of two ICs predicted the prognosis of patients with acute myeloid leukemia.17
Figure 8.
Schematic summary of PD-L1 and TIM3/TIGIT combination for OS analysis in patients with ESCC. ESCC, esophageal squamous cell carcinoma; IC, immune checkpoint; PD-L1, programmed cell death 1 ligand 1; TIGIT, T-cell immunoglobulin and immunoreceptor tyrosine-based inhibitory motif domain; TIM3, T-cell immunoglobulin and mucin-domain-containing-3; TNM, primary tumor, regional lymph node, distant metastasis.
Due to the limited clinical activity of ICB monotherapy, the combination of ICBs is actively pursued.4 23 Existing evidence suggested that PD-1/PD-L1 and CTLA4 dual blockade improved the immune response, but at the price of toxicities.24 Optimized combinations are urgently needed. A study showed that the combination of TIM3 and PD-1/PD-L1 blockades could reverse T-cell exhaustion in patients with melanoma.25 Moreover, the synergistic blockade of PD-L1 and TIGIT can significantly eliminate tumor cells.26 In ESCC, a combination of PD-L1/TIM3 or PD-L1/TIGIT blockade may be helpful.
TILs inside the tumor microenvironment are the key to tumor eradication. Expression of ICs leads to exhaustion of T cells,9 while these checkpoints are induced by immune regulatory factors from TILs.11 27 28 In vitro evidence showed CD8+ T cells significantly upregulated the expression of PD-L1 on tumor cell lines.12 29 TIM3 is positively correlated with CD8+ TIL11 and the combined blockade of PD-1/PDL1 and Tim-3/galectin-9 can prevent exhaustion of CD8+ T cells in hematological malignancies.30 TIGIT+CD8+ T cells infiltration predicts the poor prognosis and immune escape of patients with cancer.28 The synergistic blocking of TIGIT and PD-L1 mainly acts through CD8+ T cells26. In this study, high expression of CD8 was associated with poor OS in patients with ESCC, which might be due to the T-cell exhaustion by upregulating ICs. Interestingly, PD-L1/TIM3 or PD-L1/TIGIT had a positive correlation with CD8+ T cells. Furthermore, PD-1 and TIM3/TIGIT were primarily coexpressed on CD8+ T cells in patients with ESCC. Hence, it is reasonably inferred that the synergistic blockade of either PD-L1/TIM3 or PD-L1/TIGIT reverses the inhibitory phenotypes of TILs. Accumulating data are needed to confirm the negative regulatory effects of coexpression of PD-L1/TIM3 or PD-L1/TIGIT in patients with ESCC.
This study had limitations. One limitation was no patients in our study were exposed to ICB treatment and the impact of ICB treatment could not be evaluated. Also, the relatively small sample size restricted any further analysis. Besides, as a retrospective study, bias was almost inevitable. The conclusion of our study should be considered with caution.
Conclusion
To our best knowledge, we revealed for the first time that PD-L1/TIM3 and PD-L1/TIGIT were the optimal combinations for predicting the prognosis of patients with ESCC, which might be potential immune targets for developing combined ICBs therapy.
Acknowledgments
The authors would like to thank the Key Laboratory for Regenerative Medicine of the Ministry of Education, Jinan University, for providing the experimental platform to perform immunohistochemistry.
Footnotes
YW and ZD contributed equally.
PW and YC contributed equally.
Contributors: ZD contributed to the concept development and study design. PW performed an experiment, interpreted the data, and wrote the paper. YC assisted in analyzing data and writing the paper. QLong, QLi, JT, and TL carried out data management and statistical analysis. YW provided esophageal squamous cell carcinoma samples and edited the manuscript. All authors read and approved the final manuscript.
Funding: This work was supported by grants from the Clinical Research Incubation Project, West China Hospital, Sichuan University (No. 2020HXFH056), and the National Natural Science Foundation of China (No. 31971164).
Competing interests: None declared.
Provenance and peer review: Not commissioned; internally peer reviewed.
Supplemental material: This content has been supplied by the author(s). It has not been vetted by BMJ Publishing Group Limited (BMJ) and may not have been peer-reviewed. Any opinions or recommendations discussed are solely those of the author(s) and are not endorsed by BMJ. BMJ disclaims all liability and responsibility arising from any reliance placed on the content. Where the content includes any translated material, BMJ does not warrant the accuracy and reliability of the translations (including but not limited to local regulations, clinical guidelines, terminology, drug names and drug dosages), and is not responsible for any error and/or omissions arising from translation and adaptation or otherwise.
Data availability statement
Data are available upon reasonable request. All data relevant to the study are included in the article or uploaded as supplementary information.
Ethics statements
Patient consent for publication
Not applicable.
Ethics approval
This study was approved by the ethics committee of the Second Affiliated Hospital of South China University of Technology (No. K-2021-056-01). All experimental procedures were performed according to the Declaration of Helsinki.
References
- 1.Abnet CC, Arnold M, Wei W-Q. Epidemiology of esophageal squamous cell carcinoma. Gastroenterology 2018;154:360–73. 10.1053/j.gastro.2017.08.023 [DOI] [PMC free article] [PubMed] [Google Scholar]
- 2.Sung H, Ferlay J, Siegel RL, et al. Global cancer statistics 2020: GLOBOCAN estimates of incidence and mortality worldwide for 36 cancers in 185 countries. CA Cancer J Clin 2021;71:209–49. 10.3322/caac.21660 [DOI] [PubMed] [Google Scholar]
- 3.Rustgi AK, El-Serag HB. Esophageal carcinoma. N Engl J Med 2014;371:2499–509. 10.1056/NEJMra1314530 [DOI] [PubMed] [Google Scholar]
- 4.Baba Y, Nomoto D, Okadome K, et al. Tumor immune microenvironment and immune checkpoint inhibitors in esophageal squamous cell carcinoma. Cancer Sci 2020;111:3132–41. 10.1111/cas.14541 [DOI] [PMC free article] [PubMed] [Google Scholar]
- 5.Chen S-B, Weng H-R, Wang G, et al. Prognostic factors and outcome for patients with esophageal squamous cell carcinoma underwent surgical resection alone: evaluation of the seventh edition of the American Joint Committee on Cancer staging system for esophageal squamous cell carcinoma. J Thorac Oncol 2013;8:495–501. 10.1097/JTO.0b013e3182829e2c [DOI] [PubMed] [Google Scholar]
- 6.Ribas A, Wolchok JD. Cancer immunotherapy using checkpoint blockade. Science 2018;359:1350–5. 10.1126/science.aar4060 [DOI] [PMC free article] [PubMed] [Google Scholar]
- 7.Liu D. CAR-T "the living drugs", immune checkpoint inhibitors, and precision medicine: a new era of cancer therapy. J Hematol Oncol 2019;12:113. 10.1186/s13045-019-0819-1 [DOI] [PMC free article] [PubMed] [Google Scholar]
- 8.Dunn GP, Bruce AT, Ikeda H, et al. Cancer immunoediting: from immunosurveillance to tumor escape. Nat Immunol 2002;3:991–8. 10.1038/ni1102-991 [DOI] [PubMed] [Google Scholar]
- 9.Zhang W, Wang P, Pang Q. Immune checkpoint inhibitors for esophageal squamous cell carcinoma: a narrative review. Ann Transl Med 2020;8:1193. 10.21037/atm-20-4625 [DOI] [PMC free article] [PubMed] [Google Scholar]
- 10.Zhao J-J, Zhou Z-Q, Wang P, et al. Orchestration of immune checkpoints in tumor immune contexture and their prognostic significance in esophageal squamous cell carcinoma. Cancer Manag Res 2018;10:6457–68. 10.2147/CMAR.S181949 [DOI] [PMC free article] [PubMed] [Google Scholar]
- 11.Zhao Y, Chen D, Wang W, et al. Significance of TIM-3 Expression in Resected Esophageal Squamous Cell Carcinoma. Ann Thorac Surg 2020;109:1551–7. 10.1016/j.athoracsur.2019.12.017 [DOI] [PubMed] [Google Scholar]
- 12.Harada K, Mizrak Kaya D, Baba H, et al. Immune checkpoint blockade therapy for esophageal squamous cell carcinoma. J Thorac Dis 2018;10:699–702. 10.21037/jtd.2018.01.120 [DOI] [PMC free article] [PubMed] [Google Scholar]
- 13.Wang P-P, Liu S-H, Chen C-T, et al. Circulating tumor cells as a new predictive and prognostic factor in patients with small cell lung cancer. J Cancer 2020;11:2113–22. 10.7150/jca.35308 [DOI] [PMC free article] [PubMed] [Google Scholar]
- 14.Wang P, Fu Y, Chen Y, et al. Nomogram Personalizes and visualizes the overall survival of patients with triple-negative breast cancer based on the immune genome. Biomed Res Int 2020;2020:4029062. 10.1155/2020/4029062 [DOI] [PMC free article] [PubMed] [Google Scholar]
- 15.Sauerbrei W, Taube SE, McShane LM, et al. Reporting recommendations for tumor marker prognostic studies (REMARK): an abridged explanation and elaboration. J Natl Cancer Inst 2018;110:803–11. 10.1093/jnci/djy088 [DOI] [PMC free article] [PubMed] [Google Scholar]
- 16.McShane LM, Altman DG, Sauerbrei W, et al. Reporting recommendations for tumour marker prognostic studies (REMARK). Br J Cancer 2005;93:387–91. 10.1038/sj.bjc.6602678 [DOI] [PMC free article] [PubMed] [Google Scholar]
- 17.Chen C, Liang C, Wang S, et al. Expression patterns of immune checkpoints in acute myeloid leukemia. J Hematol Oncol 2020;13:28. 10.1186/s13045-020-00853-x [DOI] [PMC free article] [PubMed] [Google Scholar]
- 18.Chen C, Xu L, Gao R, et al. Transcriptome-Based co-expression of BRD4 and PD-1/PD-L1 predicts poor overall survival in patients with acute myeloid leukemia. Front Pharmacol 2020;11:582955. 10.3389/fphar.2020.582955 [DOI] [PMC free article] [PubMed] [Google Scholar]
- 19.Lagergren J, Smyth E, Cunningham D, et al. Oesophageal cancer. Lancet 2017;390:2383–96. 10.1016/S0140-6736(17)31462-9 [DOI] [PubMed] [Google Scholar]
- 20.Topalian SL, Taube JM, Anders RA, et al. Mechanism-driven biomarkers to guide immune checkpoint blockade in cancer therapy. Nat Rev Cancer 2016;16:275–87. 10.1038/nrc.2016.36 [DOI] [PMC free article] [PubMed] [Google Scholar]
- 21.He Y, Cao J, Zhao C, et al. TIM-3, a promising target for cancer immunotherapy. Onco Targets Ther 2018;11:7005–9. 10.2147/OTT.S170385 [DOI] [PMC free article] [PubMed] [Google Scholar]
- 22.Chauvin J-M, Zarour HM. TIGIT in cancer immunotherapy. J Immunother Cancer 2020;8. 10.1136/jitc-2020-000957 [DOI] [PMC free article] [PubMed] [Google Scholar]
- 23.Stahl M, Goldberg AD. Immune checkpoint inhibitors in acute myeloid leukemia: novel combinations and therapeutic targets. Curr Oncol Rep 2019;21:37. 10.1007/s11912-019-0781-7 [DOI] [PubMed] [Google Scholar]
- 24.Yang H, Wang K, Wang T, et al. The combination options and predictive biomarkers of PD-1/PD-L1 inhibitors in esophageal cancer. Front Oncol 2020;10:300. 10.3389/fonc.2020.00300 [DOI] [PMC free article] [PubMed] [Google Scholar]
- 25.Fourcade J, Sun Z, Benallaoua M, et al. Upregulation of Tim-3 and PD-1 expression is associated with tumor antigen-specific CD8+ T cell dysfunction in melanoma patients. J Exp Med 2010;207:2175–86. 10.1084/jem.20100637 [DOI] [PMC free article] [PubMed] [Google Scholar]
- 26.Johnston RJ, Comps-Agrar L, Hackney J, et al. The immunoreceptor TIGIT regulates antitumor and antiviral CD8(+) T cell effector function. Cancer Cell 2014;26:923–37. 10.1016/j.ccell.2014.10.018 [DOI] [PubMed] [Google Scholar]
- 27.Zhou QH, K. W L, Chen X. HHLA2 and PD-L1 co-expression predicts poor prognosis in patients with clear cell renal cell carcinoma. J Immunother Cancer 2020;8. [DOI] [PMC free article] [PubMed] [Google Scholar]
- 28.Liu Z, Zhou Q, Wang Z, et al. Intratumoral TIGIT+ CD8+ T-cell infiltration determines poor prognosis and immune evasion in patients with muscle-invasive bladder cancer. J Immunother Cancer 2020;8. 10.1136/jitc-2020-000978 [DOI] [PMC free article] [PubMed] [Google Scholar]
- 29.Huang C-Y, Wang Y, Luo G-Y, et al. Relationship between PD-L1 expression and CD8+ T-cell immune responses in hepatocellular carcinoma. J Immunother 2017;40:323–33. 10.1097/CJI.0000000000000187 [DOI] [PubMed] [Google Scholar]
- 30.Zhou Q, Munger ME, Veenstra RG, et al. Coexpression of Tim-3 and PD-1 identifies a CD8+ T-cell exhaustion phenotype in mice with disseminated acute myelogenous leukemia. Blood 2011;117:4501–10. 10.1182/blood-2010-10-310425 [DOI] [PMC free article] [PubMed] [Google Scholar]
Associated Data
This section collects any data citations, data availability statements, or supplementary materials included in this article.
Supplementary Materials
jitc-2021-002836supp001.pdf (14.3KB, pdf)
jitc-2021-002836supp002.pdf (32.5KB, pdf)
jitc-2021-002836supp003.pdf (482.4KB, pdf)
jitc-2021-002836supp004.pdf (442.8KB, pdf)
jitc-2021-002836supp005.pdf (453.1KB, pdf)
jitc-2021-002836supp007.pdf (535.3KB, pdf)
jitc-2021-002836supp006.pdf (11KB, pdf)
jitc-2021-002836supp008.pdf (194.6KB, pdf)
jitc-2021-002836supp009.pdf (447.9KB, pdf)
Data Availability Statement
Data are available upon reasonable request. All data relevant to the study are included in the article or uploaded as supplementary information.


