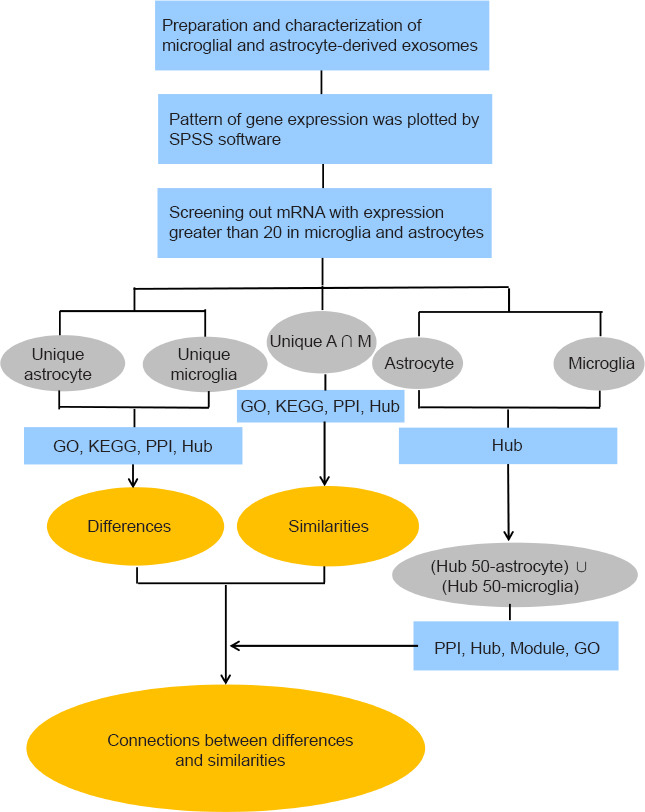
Figure 1.

Workflow of the study.
The arrows represent the sequence of the analyses. The main results in the ellipse (in orange) were obtained by the analytical steps that are briefly described in the blue rectangles. The terms in the grey ellipses correspond to the group names. GO: Gene Ontology; KEGG: Kyoto Encyclopedia of Genes and Genomes; PPI: protein-protein interaction network; SPSS: Statistical Product and Service Solutions software.
