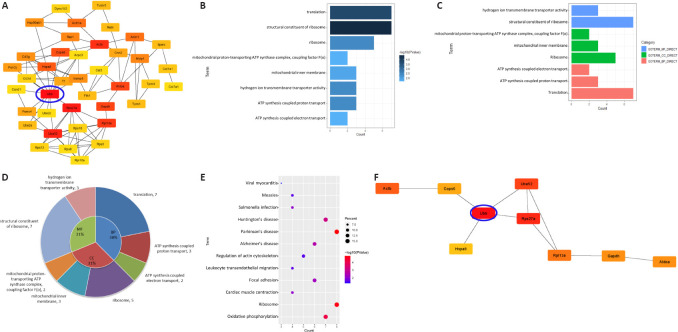
Figure 6.
Similarities between exosomes from astrocytes and microglia determined by analysis of the unique astrocyte and microglia (unique A ∩ M) group.
(A) The network of the top 50 hub genes in the unique A ∩ M group. Genes are marked from red to yellow based on their interaction score in the PPI network analysis using cytoHubba (Radiality). (B) The length of the bars of the terms contained in the bar chart is directly proportional to the number of enriched genes in the GO analysis. The darker the color, the more significant the term. (C) Bar charts of GO terms divided into MF, BP and CC. (D) Pie chart demonstrating the proportion of CC, MF and BP. The specific terms and the number of genes are shown in the outer circle. (E) Bubble diagram showing the KEGG analysis. P indicated in red is significantly higher than that in blue. The dot size is proportional to the number of genes that are involved in the pathway. (F) The top 10 hub genes in the unique A ∩ M group are marked in red to yellow based on their interaction score in the PPI network analysis using cytoHubba (Bottleneck). Their biological characteristics are listed in Table 3. The Ubb node with the most direct interactions is highlighted in the brightest red and the blue circle. BP: biological process; CC: cellular component; GO: Gene Ontology; KEGG: Kyoto Encyclopedia of Genes and Genomes; MF: molecular function; PPI: protein-protein interaction network; Ubb: ubiquitin B.

