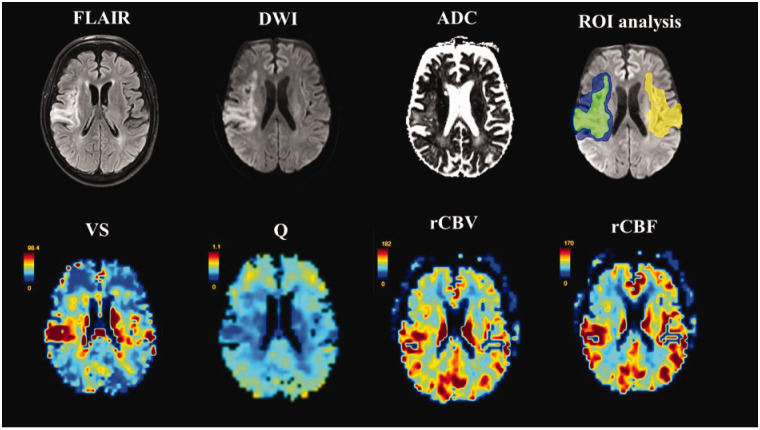
Figure 1.
Top row from left to right: FLAIR, diffusion weighted imaging (DWI), and apparent diffusion coefficient (ADC) images with schematic depiction of selected ROI (region of interest) delineations on baseline DWI (green=lesion; blue=perilesional space; yellow=contralateral healthy). Bottom row from left to right: corresponding VS (vessel size; [μm]), Q (vessel density index; [s−1/3]), and relative cerebral blood volume (rCBV) and blood flow (rCBF) maps derived from contrast-enhanced vessel size imaging.

