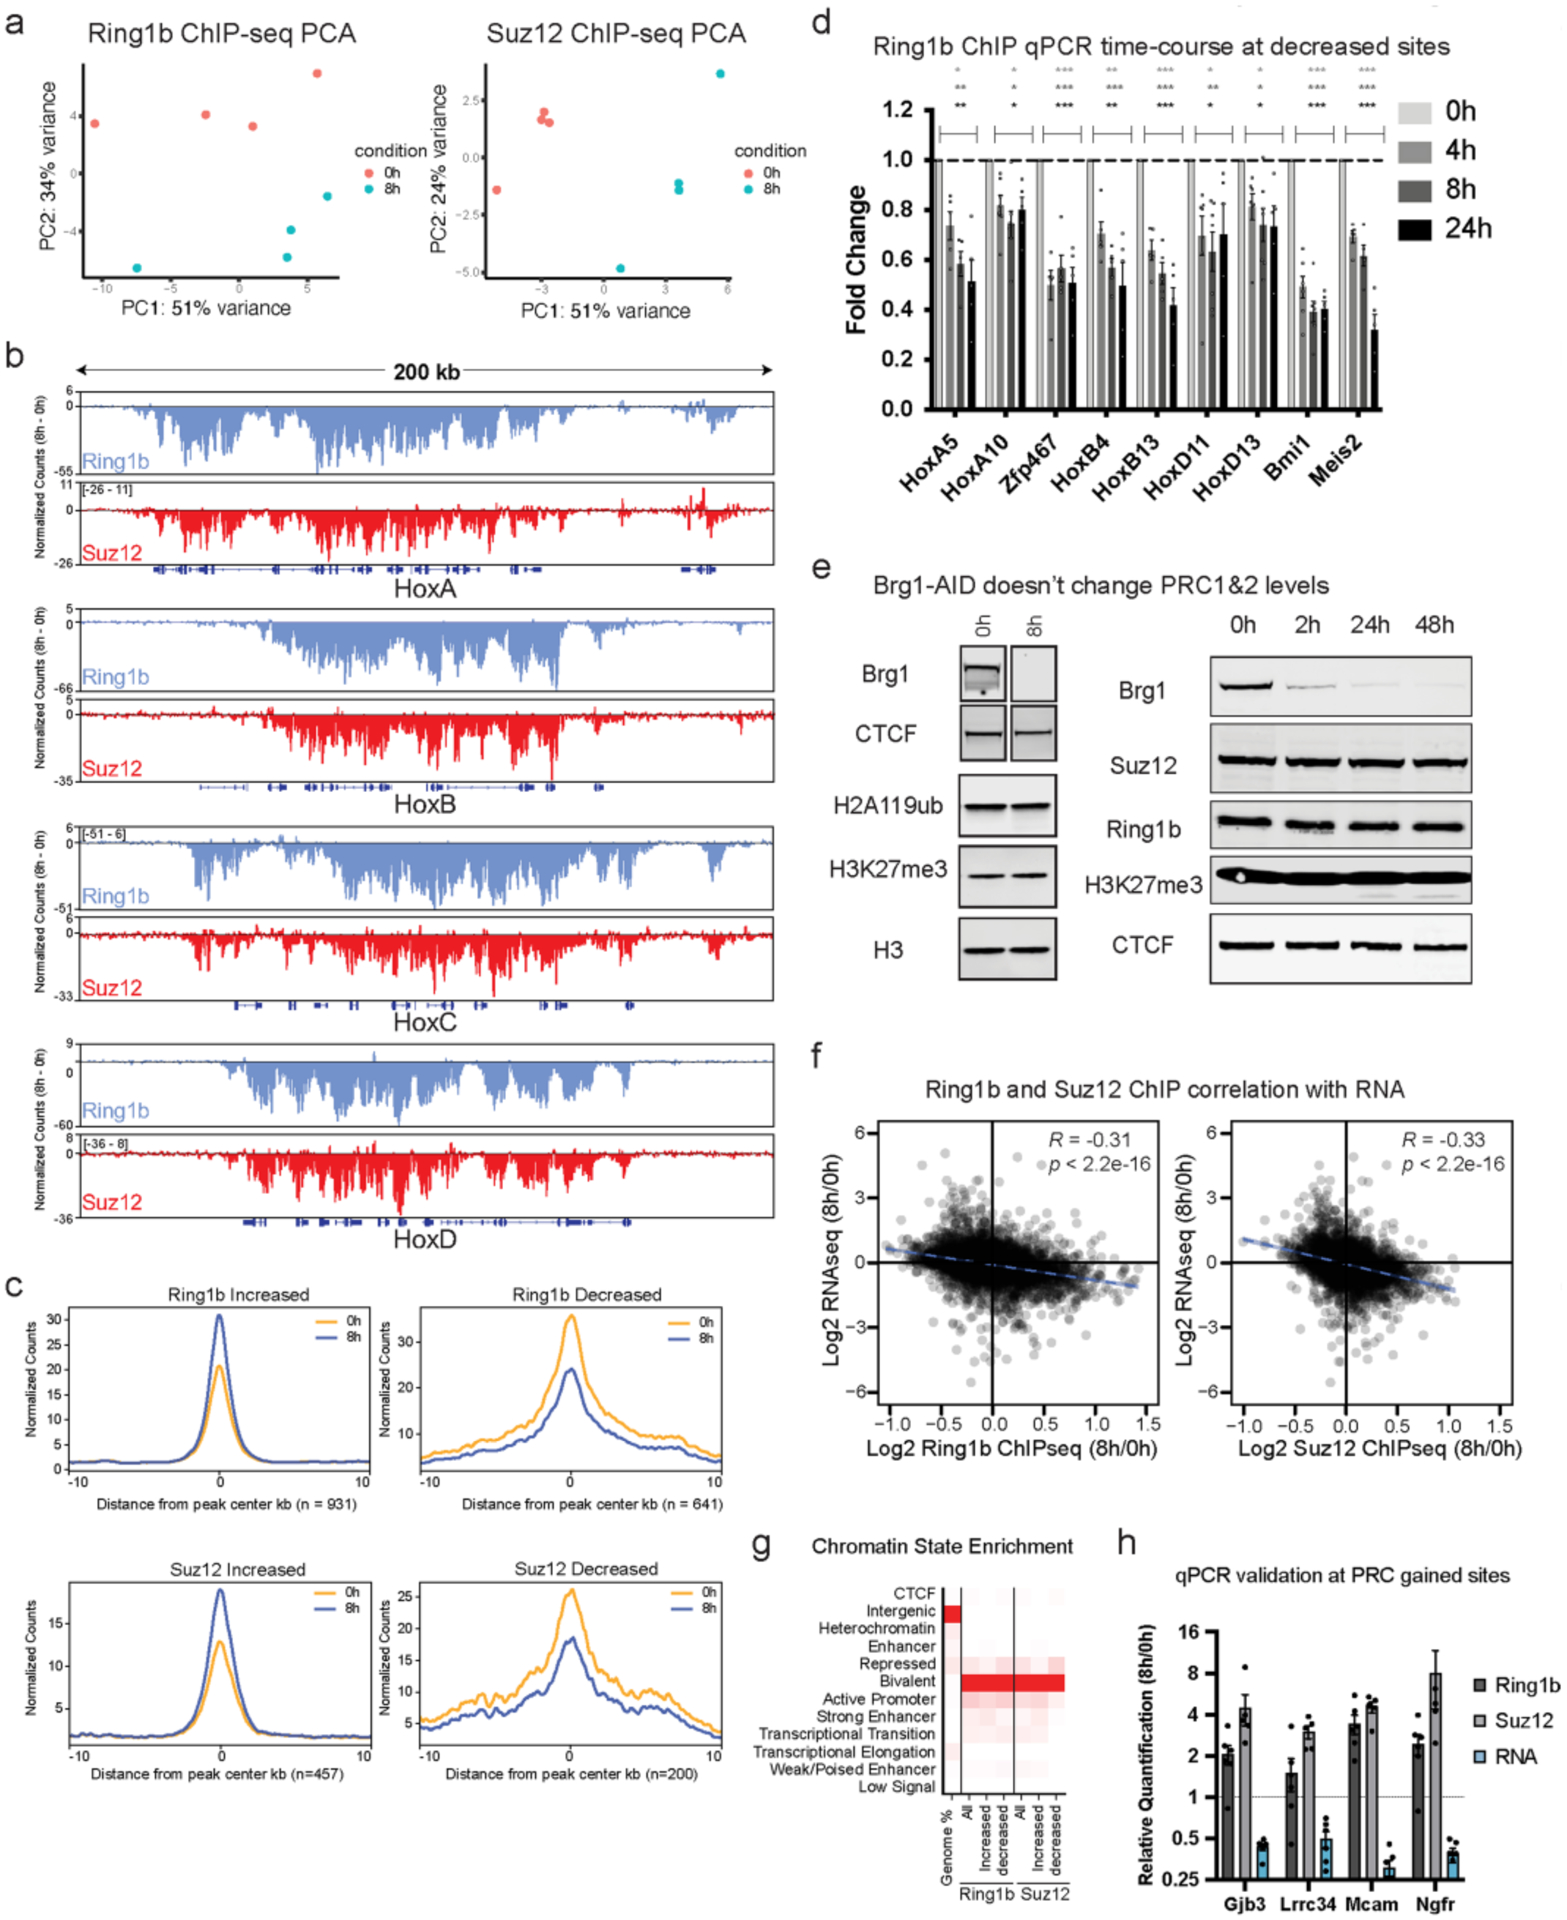
Extended Data Fig. 3 |. Brg1 degradation results in quick redistribution of PRC1&2 but doesn’t affect net dosage, related to Fig. 2.

a, Principal component analysis of Ring1b and Suz12 ChIP-seq (n = 4 replicates) b, Browser snapshot of the difference in normalized counts (8 h – 0 h) for Ring1b and Suz12 at Hox A, B, C, and D depicting net loss across all four clusters. c, Average metagene plots of normalized counts (to read-depth) at sites that were significantly increased or decreased by DESeq2 analysis (FDR-corrected P < 0.1) and normalized to peak intensity, providing additional confirmation that normalization is correct. d, ChIP qPCR timecourse at 4, 8, and 24 h Brg1 degradation for Ring1b at sites that were significantly decreased by ChIP-seq. Error bars depict standard error of the mean from four biological replicates. (* = p < 0.05, ** = p < 0.005, *** = p < 0.0005; two-sided t test with Holm-Sidak multiple comparison correction). e, (left) Representative western blot showing Brg1 degradation efficiency and that H2AK119ub and H3K27me3 marks don’t change at 8 h time-point (ChIP-seq time-point for the complexes that deposit these marks), (right) Representative western showing Brg1 degradation efficiency over a longer timecourse and that Suz12, Ring1b, and H3K27me3 marks don’t noticeably change even at 48 h. Experiment was repeated at least 2 times with similar results (f) Correlation of all Ring1b and Suz12 peaks that are ± 2kb from gene transcription start sites and expression changes at 8 h Brg1 degradation. Correlation and p values were obtained from Pearson’s product moment correlation. g, chromatin state enrichment for all, increased, and decreased peak changes for Ring1b and Suz12. h, ChIP qPCR and qRT-PCR validation of genes that gain Ring1b and Suz12 and have reduced gene expression following 8 h Brg1 degradation. Error bars depict standard error of the mean from five biological replicates.
