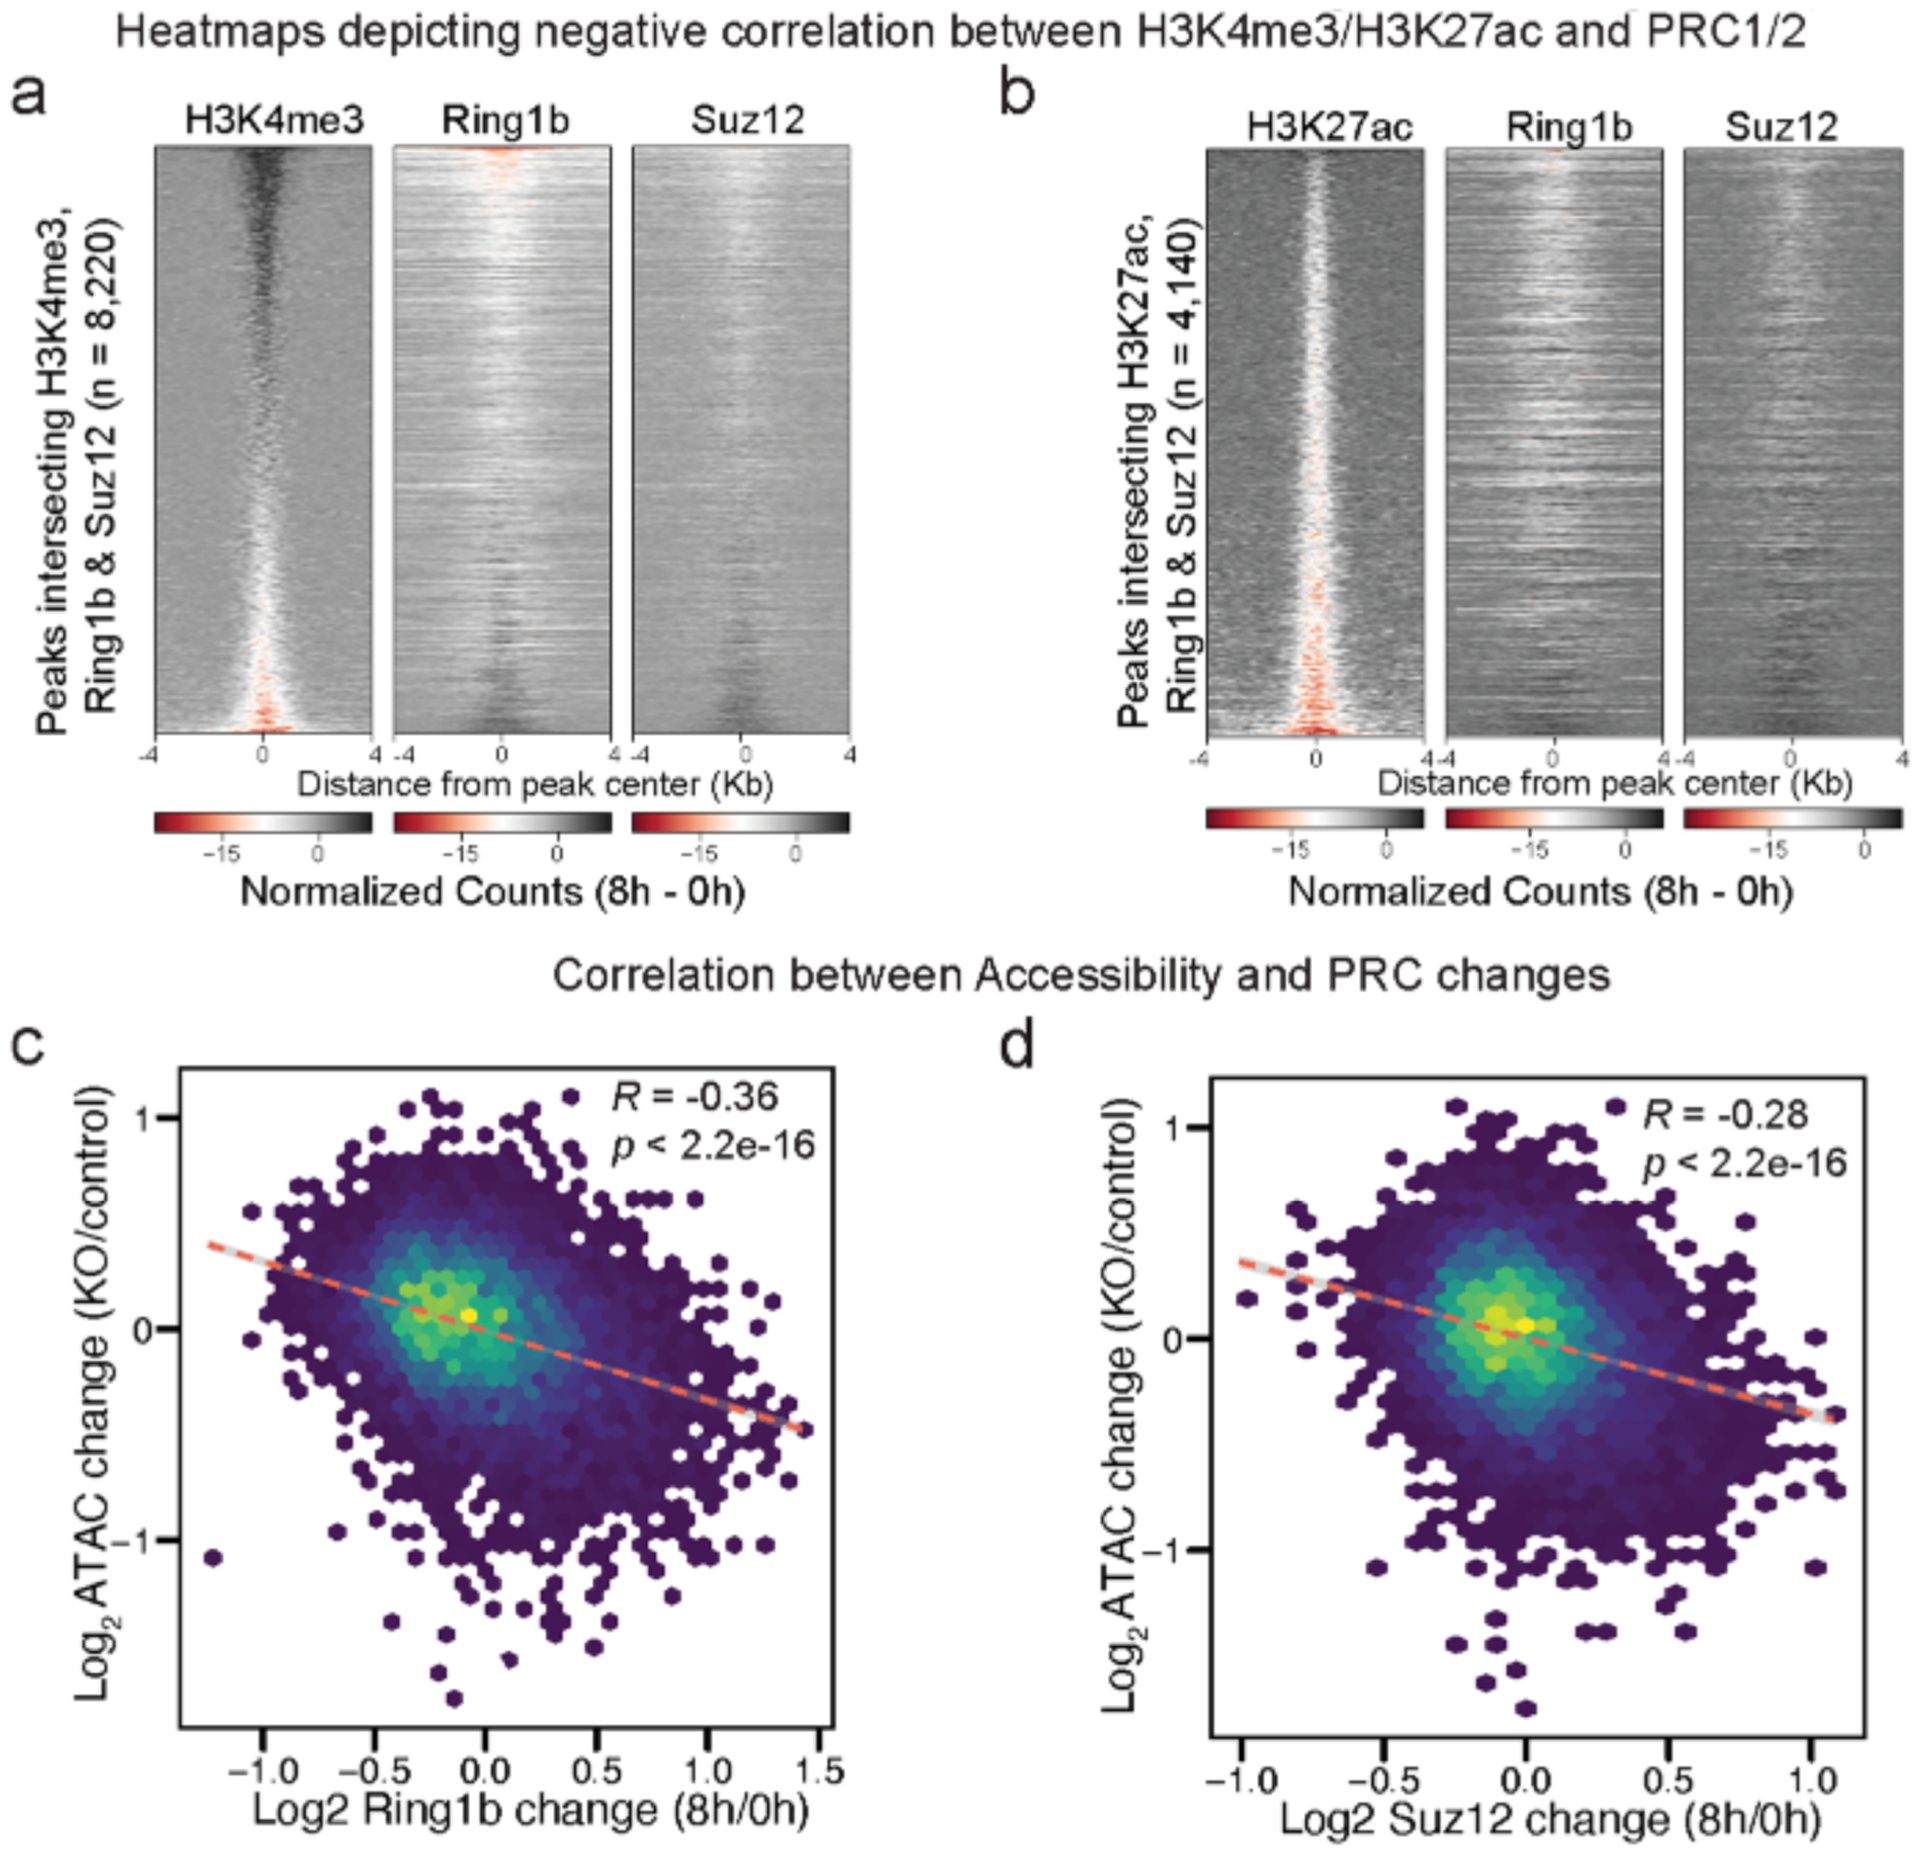
Extended Data Fig. 5 |. Extended analysis related to Fig. 4.

a, Heatmap depicting the negative correlation between H3K4me3 and Ring1b and Suz12 as the difference in normalized counts (8 h – 0 h) at peaks (8,220) that intersect H3K4me3, Ring1b, and Suz12 at merged peak center, sorted by decreasing H3K4me3 signal. b, Heatmap depicting the negative correlation between H3K27ac and PRC1&2 as the difference in normalized counts (8 h – 0 h) at peaks (4,140) that intersect H3K27ac, Ring1b, and Suz12 at merged peak center, sorted by decreasing H3K27ac signal. c,d, Scatterplots showing negative correlation between ATAC-seq changes (KO/control)44 and Ring1b (8 h/0 h) or Suz12 (8 h/0 h).
