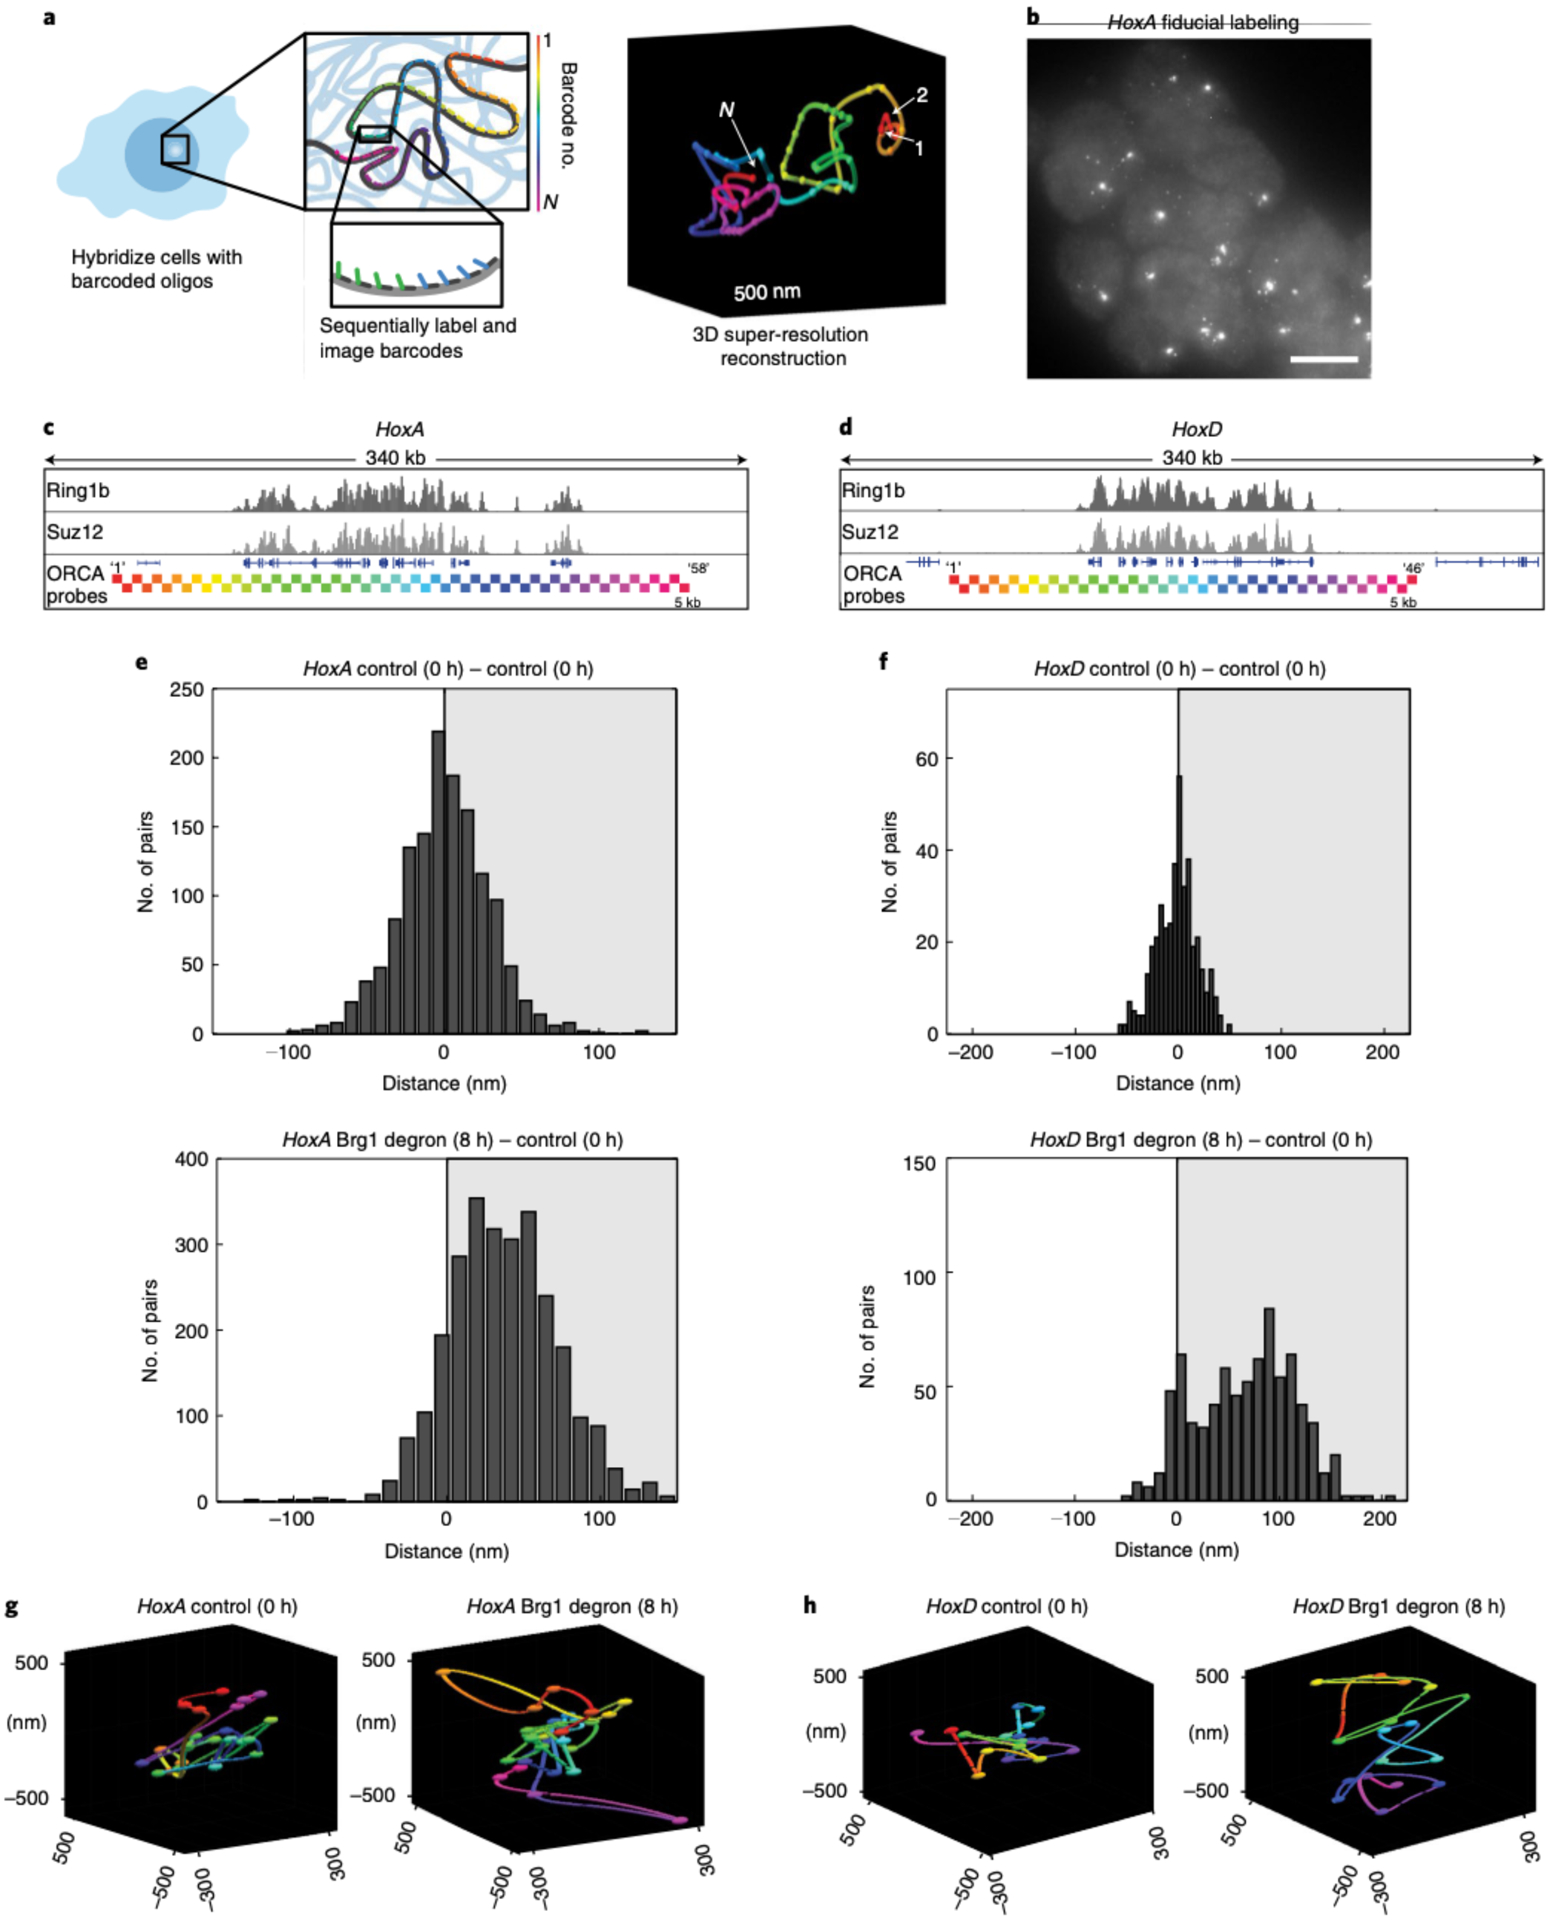
Fig. 3 |. Brg1 degradation and Polycomb loss result in decompaction of HoxA and HoxD regions.

a, Schematic of the ORCA method, where sequential imaging and labeling of fluorescent barcodes (numbers 1 to N) are artificially color-coded by barcode number, enabling reconstruction of the 3D DNA path of a DNA region. b, mESCs labeled with the HoxA probe. Each spot corresponds to one allele, and shown here is the fiducial staining, which labels the entire 290-kb HoxA region. The experiment was repeated at least three times with similar results. Scale bar, 10 μm. c,d, Genomic HoxA (c) and HoxD (d) regions labeled by ORCA. The bottom tracks illustrate the positions of probes, color-coded by barcode number, as in a. e,f, Histograms plotting the difference in median distance for all barcode pairs, where the median was calculated over all cells, between AID-treated and control cells, for HoxA (e) and HoxD (f). g,h, Representative polymers in the control and Brg1-depleted cells for HoxA (g) and HoxD (h). All experiments were conducted in serum/LIF.
