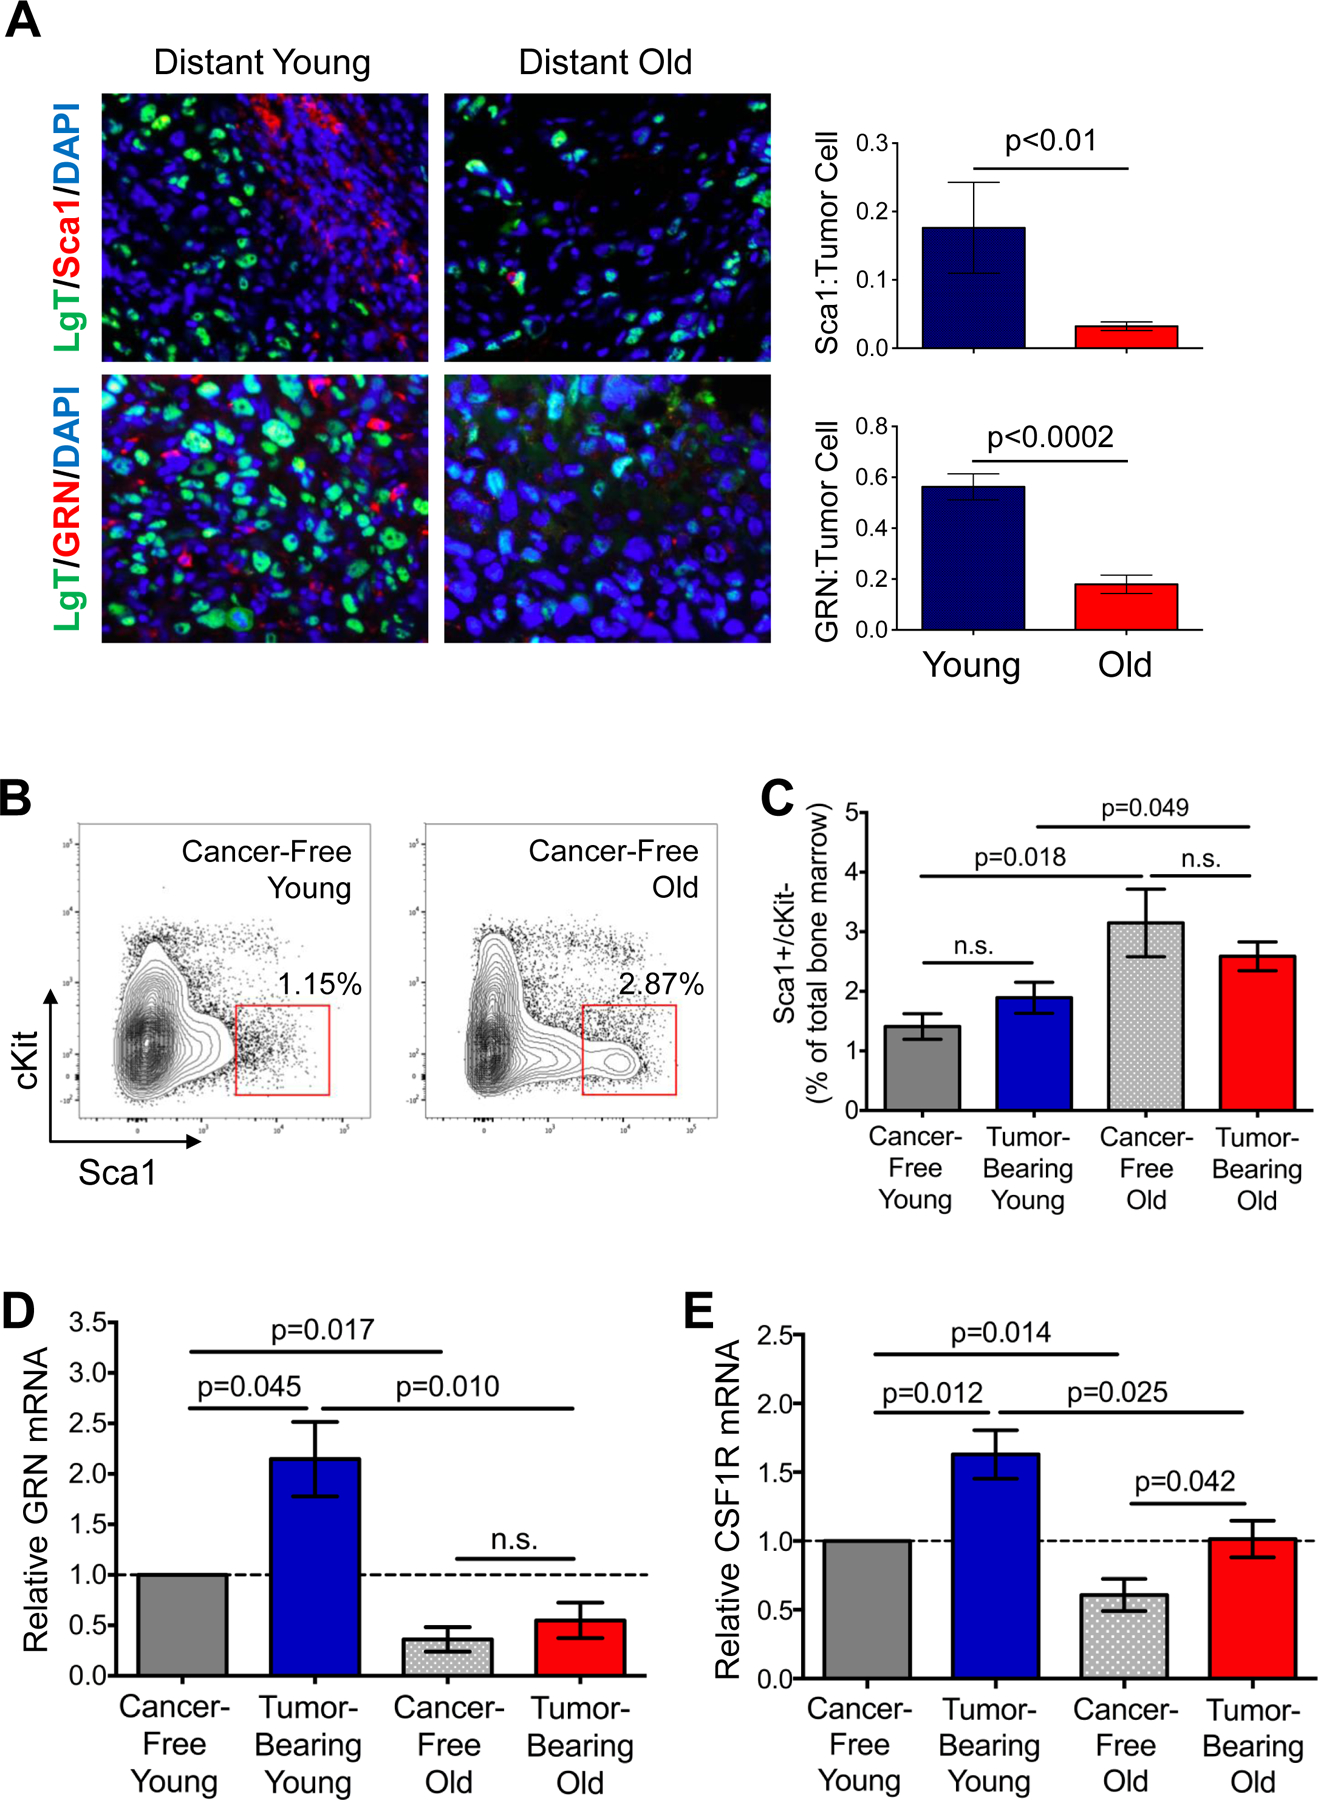
Figure 4. Age affects tumor-promoting hematopoietic bone marrow cells.

(A) Staining of distant tumors from young and old mice for LgT (green), Sca1 (red, top), or GRN (red, bottom). Cell nuclei counterstained with DAPI (blue). Graphs indicate number of Sca1+ cells or GRN+ cells recruited per LgT+ tumor cell. n=9 images for young; n=8 images for old. (B) Flow cytometry plots indicating gating strategy to isolate Sca1+/cKit- BMCs from cancer-free young (left) and old (right) mice. (C) Flow cytometric analysis of CD45+/Sca+/cKit- cells as a percent of total bone marrow in cancer-free and BPLER tumor-bearing young and old mice; n=4–6 per group. (D, E) Relative GRN (D) and CSF1R (E) mRNA in CD45+/Sca1+/cKit- BMCs isolated from indicated cohorts; values are relative to those for the identical cell population from cancer-free young mice (broken line); n=3 per group analyzed in triplicate. Data represented as mean ± SEM, analyzed using one-way ANOVA with Student’s t-test for significance; n.s.=not significant. See also Figure S3.
