
Figure 5. Bone marrow cells from young mice rescue tumor growth in old mice.
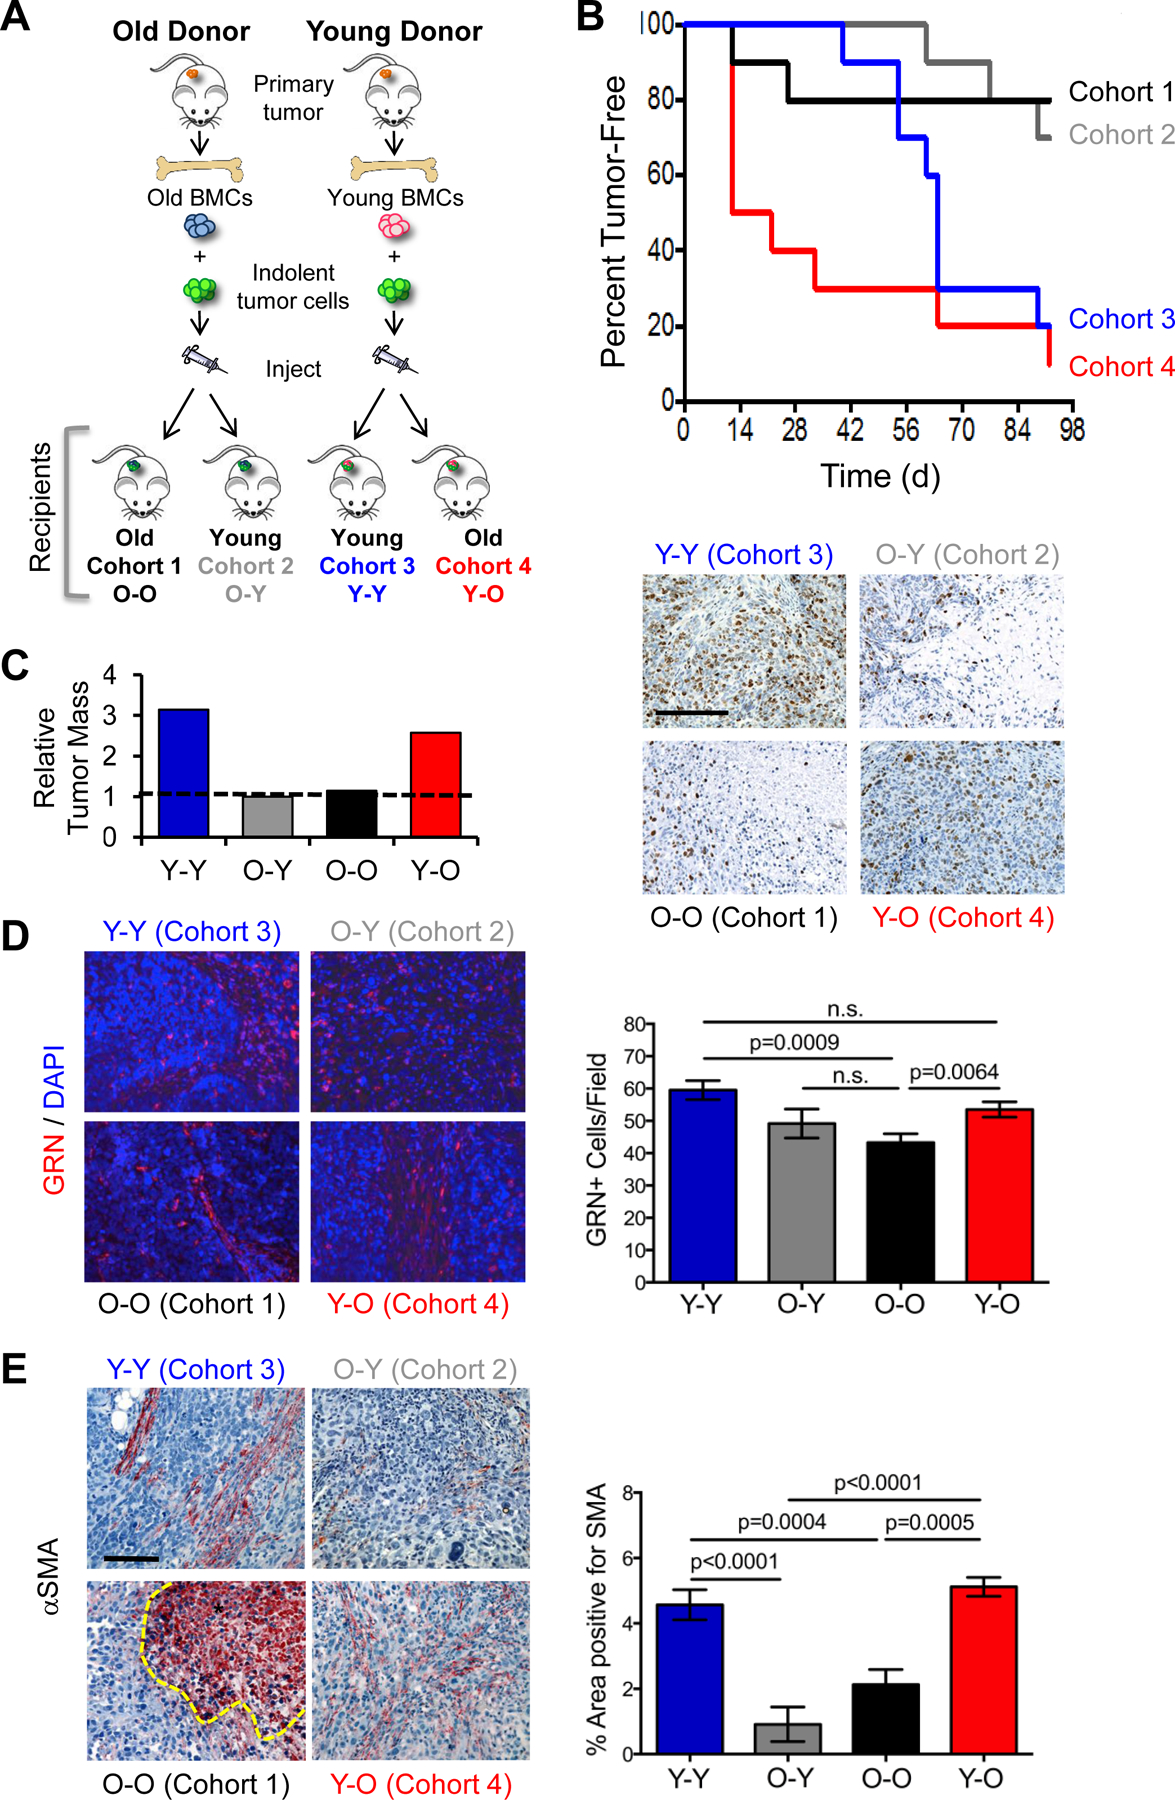
(A) Experimental protocol for BMC functional assay in young and old mice. BMCs were isolated from young or old mice bearing human breast tumors, mixed with HMLER-HR human tumor cells ex vivo, and subcutaneously injected into young or old secondary host mice. (B) Incidence of tumor formation in recipient cohorts during a 90-day time course (n=10/cohort). (C) Final tumor mass (graph) and images of tumors from (B) stained for Ki67 (brown); cell nuclei counterstained with DAPI (blue); scale bar=200μm (D) Tumors from (B) stained for GRN (red; 20x magnification). Cell nuclei counterstained with DAPI (blue). Graph represents average number of GRN-positive cells per field (n=4–5 fields per tumor, with 2–4 tumors per group). (E) Tumors from (B) stained for αSMA (red); cell nuclei were counterstained with hematoxylin (blue); scale bar=100 μm. *Denotes necrotic area with non-specific uptake of chromogen. Graph represents percent average area of SMA-positive staining (n=4 fields per tumor, with 2–4 tumors per group). Data represented as mean ± SEM; n.s.=not significant. Data analyzed using one-way ANOVA and Student’s t-test for significance. See also Figures S4, S5.