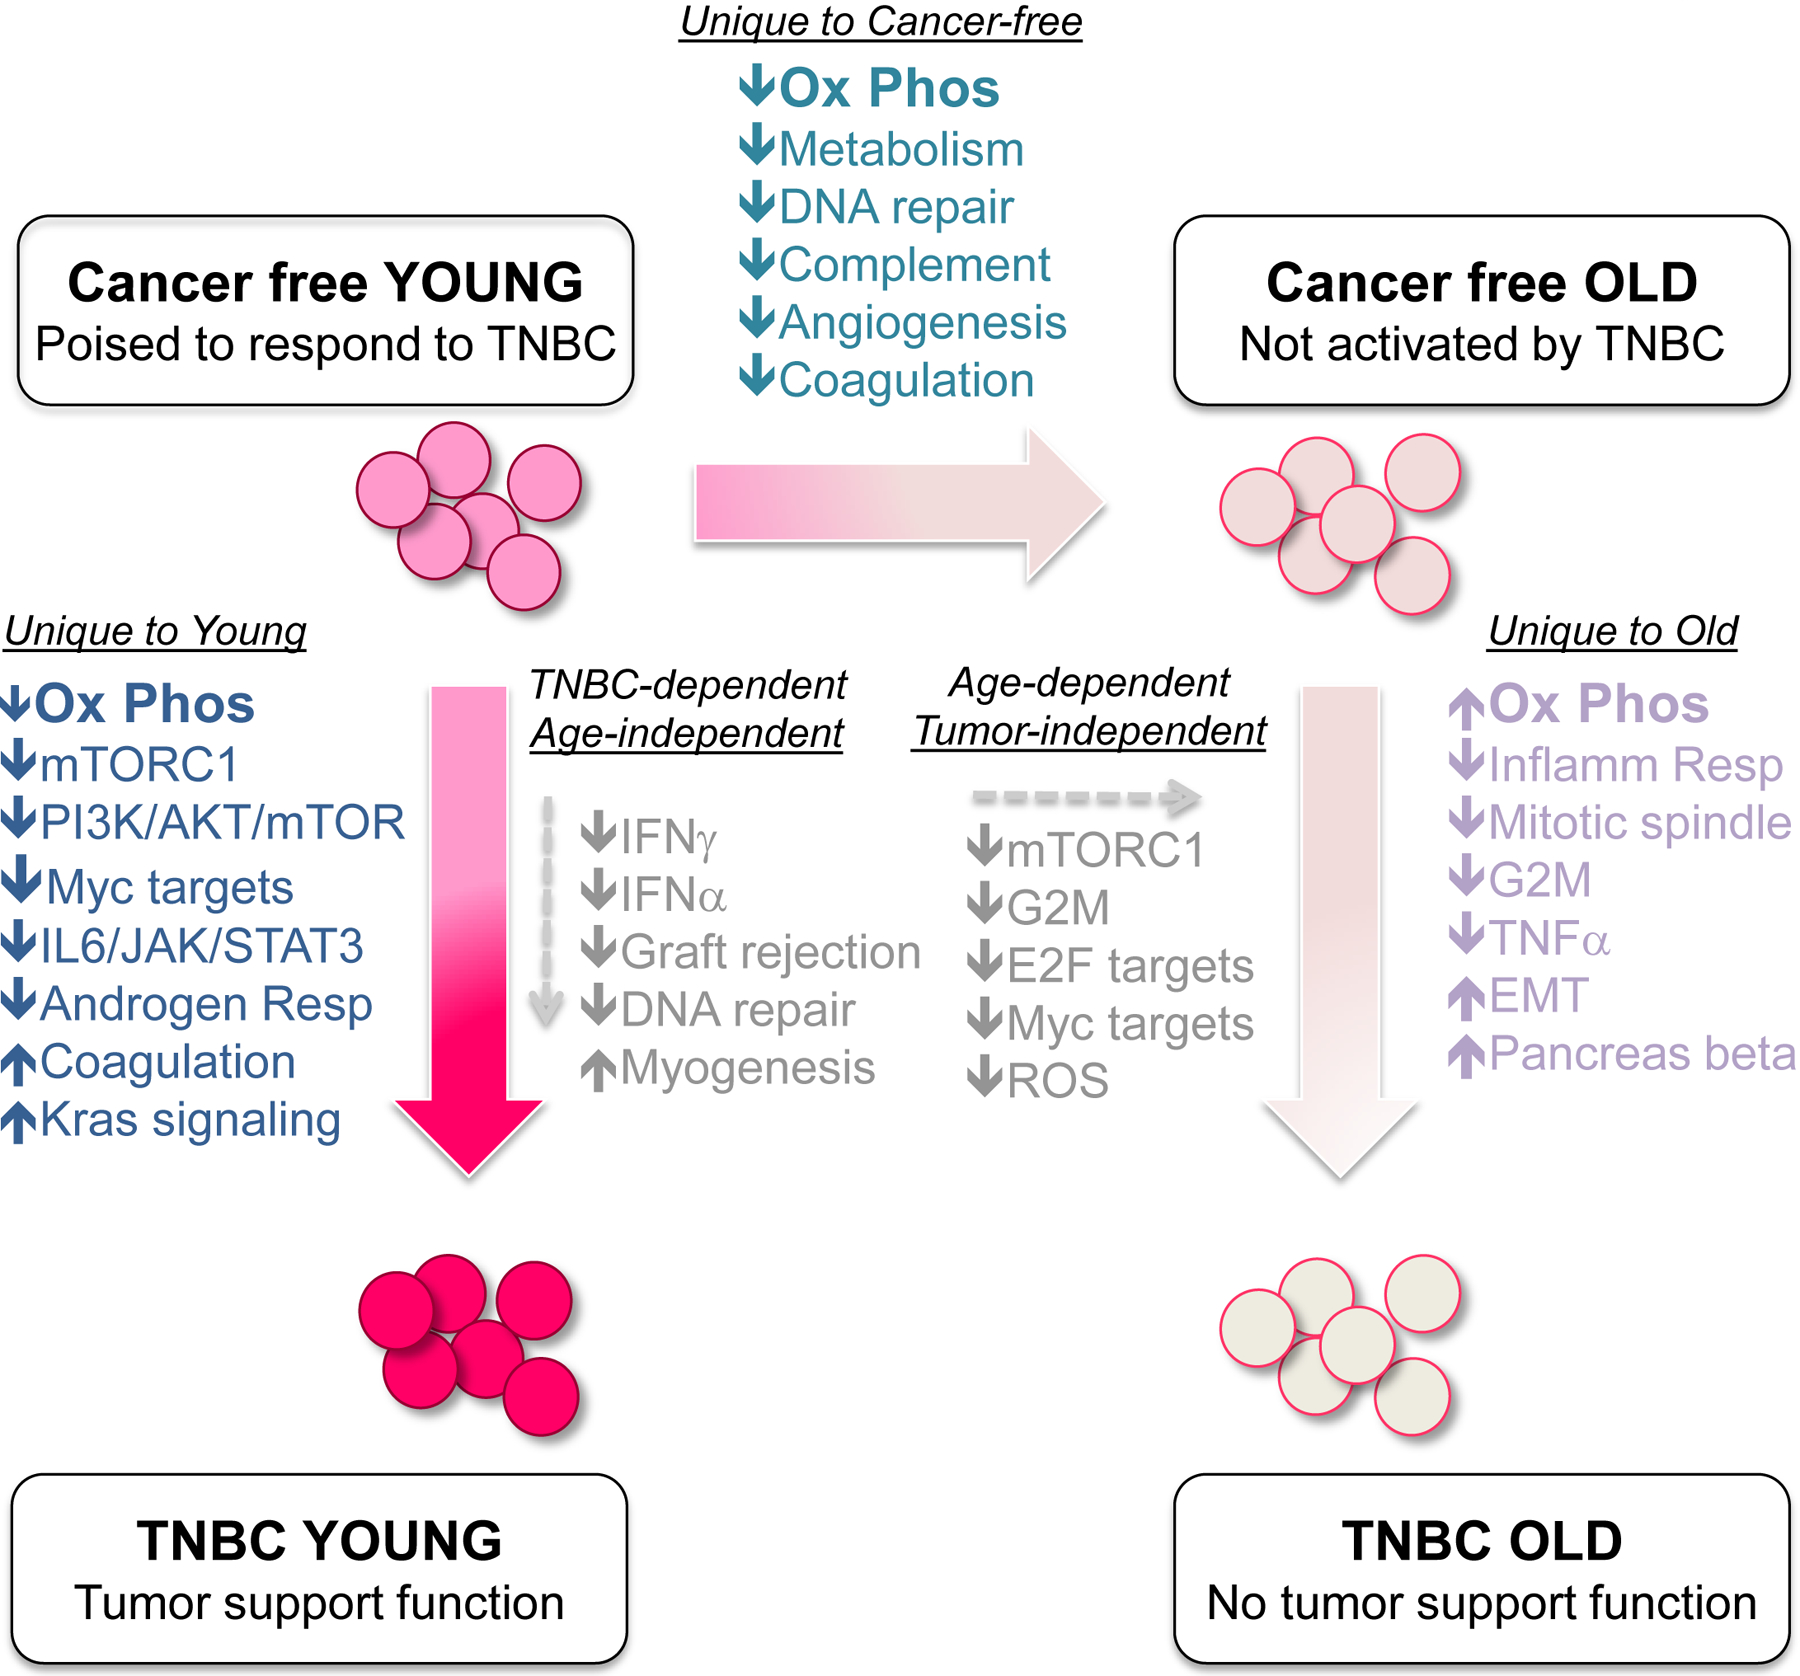
Figure 6. Gene set enrichment analysis of expression data from TP-BMCs of young and old cancer-free and TNBC tumor-bearing mice.

Gene expression profiling was performed on Sca1+/cKit- BMCs from indicated cohorts of mice and enrichment analyses conducted to identify groups of genes differentially represented (at statistical significance) when comparing various cohorts. Pathways unique to young mice when comparing cancer-free to TNBC are represented in dark blue text. Pathways uniquely altered with age in cancer-free animals are indicated in teal text. Pathways uniquely altered in the BMCs from old mice when comparing cancer-free to TNBC are listed in lavender text. Pathways shared in common when comparing either cancer-free to TNBC (regardless of age), or young to old (regardless of disease status) are represented in the center of diagram. See Figs. S6, S7, Tables S1 and S2; GEO GSE74120.
