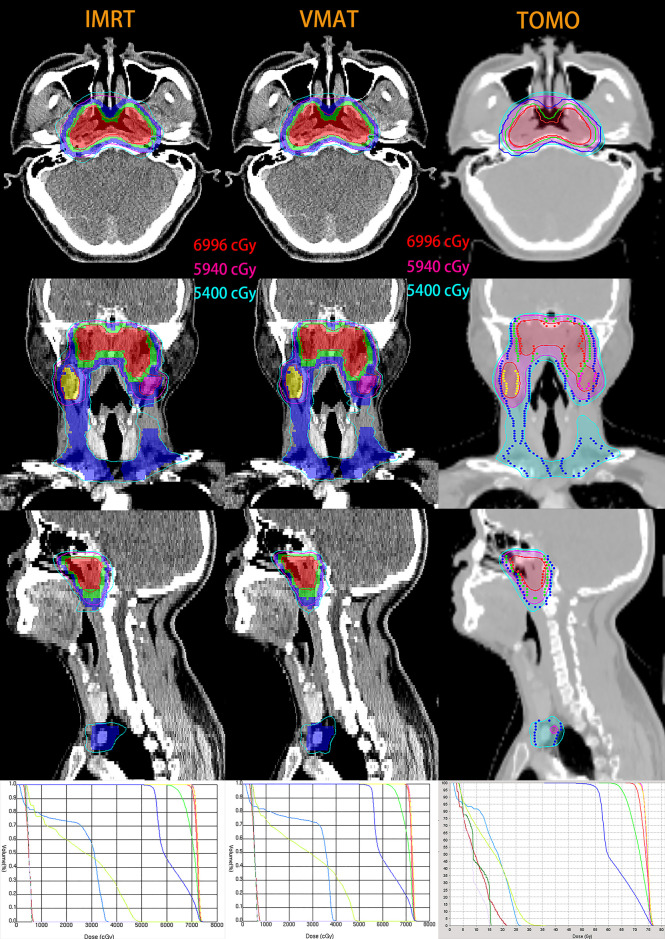
Figure 1.
Isodose distributions and dose-volume histograms (DVHs) for a representative T1-stage NPC patient with IMRT (left), VMAT (middle) and TOMO (right) planning. Maroon, forest, lavender, yellow-green, light-blue, red, green and blue lines in three DVH are optic nerve in left, optic nerve in right, optic chiasma, brain stem, spinal cord, PGTVnx, PCTV-1 and PCTV-2, respectively. For IMRT and VMAT planning, color-wash areas: PGTVnx (red), PGTVnd-left (purple), PGTVnd-right (yellow), PCTV-1 (green), PCTV-2 (blue); and the red, purple and sky-blue lines are isodose curves of 69.96Gy, 59.4Gy and 54Gy. For TOMO planning, isodose curves of 69.96Gy, 59.4Gy and 54Gy are shaded in the red, purple and sky-blue, respectively; targets are represented by lines: PGTVnx (red), PGTVnd-left (purple), PGTVnd-right (yellow), CTV-1 (green), PCTV-2 (blue).

