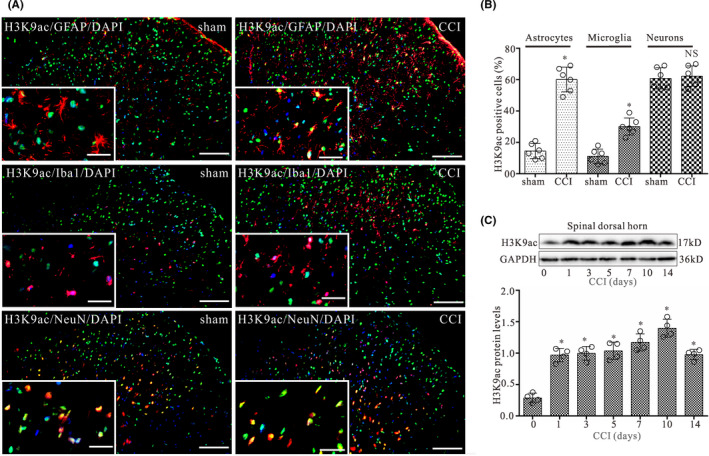
FIGURE 2.

CCI evokes increases in glial cells displaying H3K9ac expression in the spinal dorsal horn on day 14 after surgery. (A) Double‐staining immunofluorescent images showing the distribution of H3K9ac (green) in astrocytes (GFAP, red), microglia (Iba1, red), and neurons (NeuN, red) in L4‐L5 spinal dorsal horn of CCI and control groups on day 14 after surgery. Cell nuclei were stained with the DAPI (blue). Images in the white boxes are the amplification of an area in the corresponding image. Scale bar 100 μm outside the white frame and 25 μm in the white frame. (B) Graphs showing the percentage of GFAP/H3K9ac, Iba1/H3K9ac, and NeuN/H3K9ac double‐labeled cells relative to the total number of GFAP, Iba1, and NeuN‐positive cells in L4‐L5 spinal dorsal horn ipsilateral to the operation side on day 14 after CCI surgery, respectively. Data are presented as the mean ± SEM (n = 6). *p < 0.05. NS, no statistical difference. (C) Western blot analysis of H3K9ac expression in the dorsal quadrant of L4‐L5 spinal segment ipsilateral to the operation side on days 0, 1, 3, 5, 7, 10, and 14 after CCI surgery, respectively. The mean optic densities of the protein were calculated by normalizing to GAPDH. All values are expressed as the means ± SEMs (n = 4).*p < 0.05 versus sham
