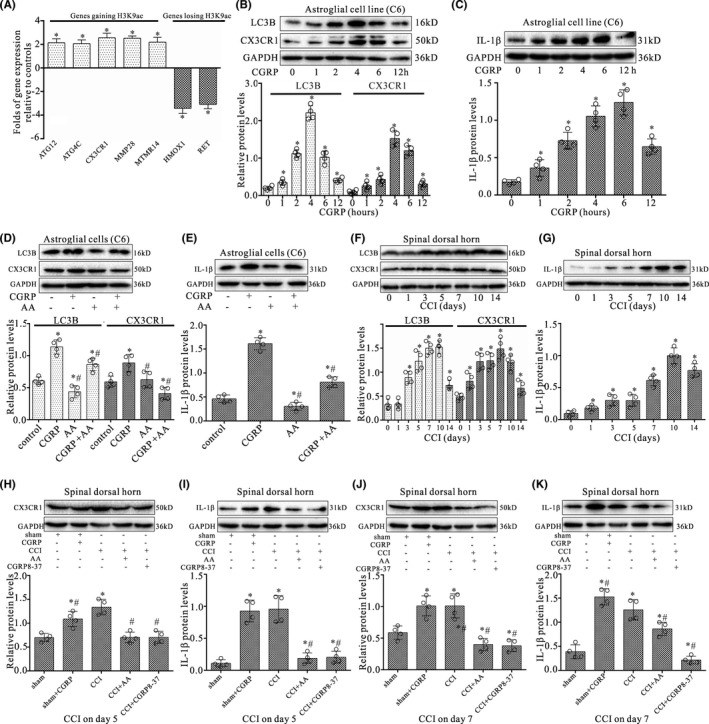
FIGURE 6.

CGRP altered the gene expression in astroglial cells associated with astrocyte activation. (A) Quantitative RT‐PCR analysis for differences in expression levels of H3K9ac specific target genes between CGRP‐treated astroglial cells and controls in the subset of genes gaining or losing H3K9ac on their promoters. Results were calculated by normalizing to GAPDH in the same sample with the ΔCt method. Changes in relative levels of gene mRNAs expressed as folds of controls. All values were mean ± SEM. *p < 0.05 (n = 3). (B, C) Western blot analyses of CX3CR1 and LC3B (B) or IL‐1β (C) expressions in astroglial cells (C6) with treatment of CGRP at 0, 1, 2, 4, 6, and 12 h, respectively. (D, E) Western blotting analyses for CX3CR1 and LC3B (D) or IL‐1β (E) protein levels in astroglial cells (C6) with co‐treatment of CGRP (1 μM) and AA (20 μM) for 4 h. (F, G) Western blot analyses of CX3CR1 and LC3B (F) or IL‐1β (G) expression in the dorsal quadrant of L4‐L5 spinal segment ipsilateral to the operation side on 0, 1, 3, 5, 7, 10, and 14 days after CCI surgery, respectively. (H‐K) Western blot analyses of CX3CR1 or IL‐1β expression in the dorsal quadrant of L4‐L5 spinal segment ipsilateral to the operation side with CCI surgery for 5 and 7 days, respectively. Data were obtained from animals treated with daily intrathecal injection of either 1 μM CGRP (10 μl), 2 μM CGRP8‐37(10 μl), 20 μM AA (10 μl), or vehicle (10 μl) for 4 and 6 days, respectively. The mean optic densities of the proteins were calculated by normalizing to GAPDH. All values are expressed as the means ± SEMs (n = 4).*p < 0.05 versus sham groups; #p < 0.05 versus CCI only groups
