FIGURE 2.

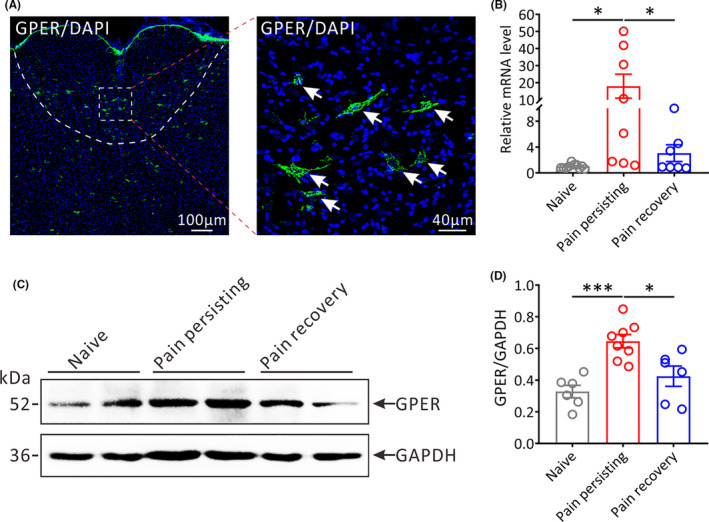
The expression of GPER in the RVM of different pain states mice. (A) Representative immunofluorescence images showing the distribution of GPER‐positive (GPER+) neurons in the RVM. The white arrows show the GPER+ neurons; Green: GPER+ neurons. Scale bars, 100 μm (left) and 40 μm (right). (B) The relative mRNA expression of Gper in the RVM of different pain states mice (Naive: n = 10, Pain persisting: n = 8, Pain recovery: n = 7; *p < 0.05, one‐way ANOVA). (C) Representative Western blot bands showing the expression of GPER in the RVM of different pain states mice (MW: GPER, 52 kDa; GAPDH, 36 kDa). (D) Statistical analysis of the expression of GPER in the RVM of different pain states mice (Naive: n = 6, Pain persisting: n = 8, Pain recovery: n = 6; *p < 0.05, ***p < 0.001, one‐way ANOVA)
