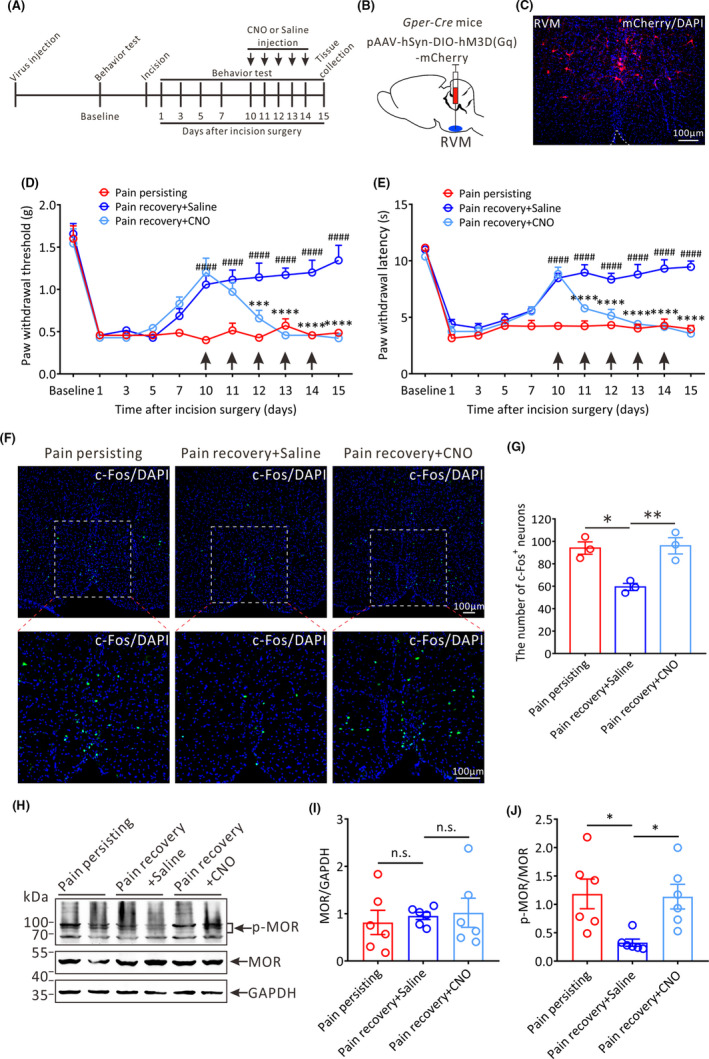
FIGURE 5.

The effects of chemogenetic activation of RVM GPER‐positive neurons on the pain threshold and MOR phosphorylation in the RVM of pain recovery mice. (A) Protocol of the experiments. CNO (3 mg kg−1 per day, i.p.) or saline (i.p.) injection is performed from 10 to 14 days after incision surgery. (B) The schematic showing the injection of pAAV‐hSyn‐DIO‐hM3D(Gq)‐mCherry into the RVM of Gper‐Cre mice. (C) Successful expression of hM3D(Gq)‐mCherry in the RVM after viral infection. Scale bar, 100 μm. (D) and (E) The PWT and PWL of the daily baseline before CNO or saline administration in three groups mice: Pain persisting mice, Pain recovery + Saline mice and Pain recovery + CNO mice (n = 7 in each group, ***p < 0.001, ****p < 0.0001, between Pain recovery + CNO mice and Pain recovery + Saline mice; ####p < 0.0001, between Pain recovery + Saline mice and Pain persisting mice, two‐way repeated measures ANOVA followed by the Bonferroni post hoc test). (F) Representative immunofluorescence images showing the distribution of c‐Fos+ neurons in the RVM of the three groups mice on 15 days after incision surgery. Green: c‐Fos +neurons. All scale bars = 100 μm. (G) Statistical analysis of the number of c‐Fos+ neurons in the RVM of three groups mice (n = 3 in each group, *p < 0.05, **p < 0.01, one‐way ANOVA). (H) Representative Western blot bands showing the expression of p‐MOR and MOR in the RVM of three groups mice. (I) and (J) Statistical analysis of the expression of MOR and p‐MOR in the RVM in three groups mice (n = 6 in each group, *p < 0.05, n.s.: no statistical difference, one‐way ANOVA)
