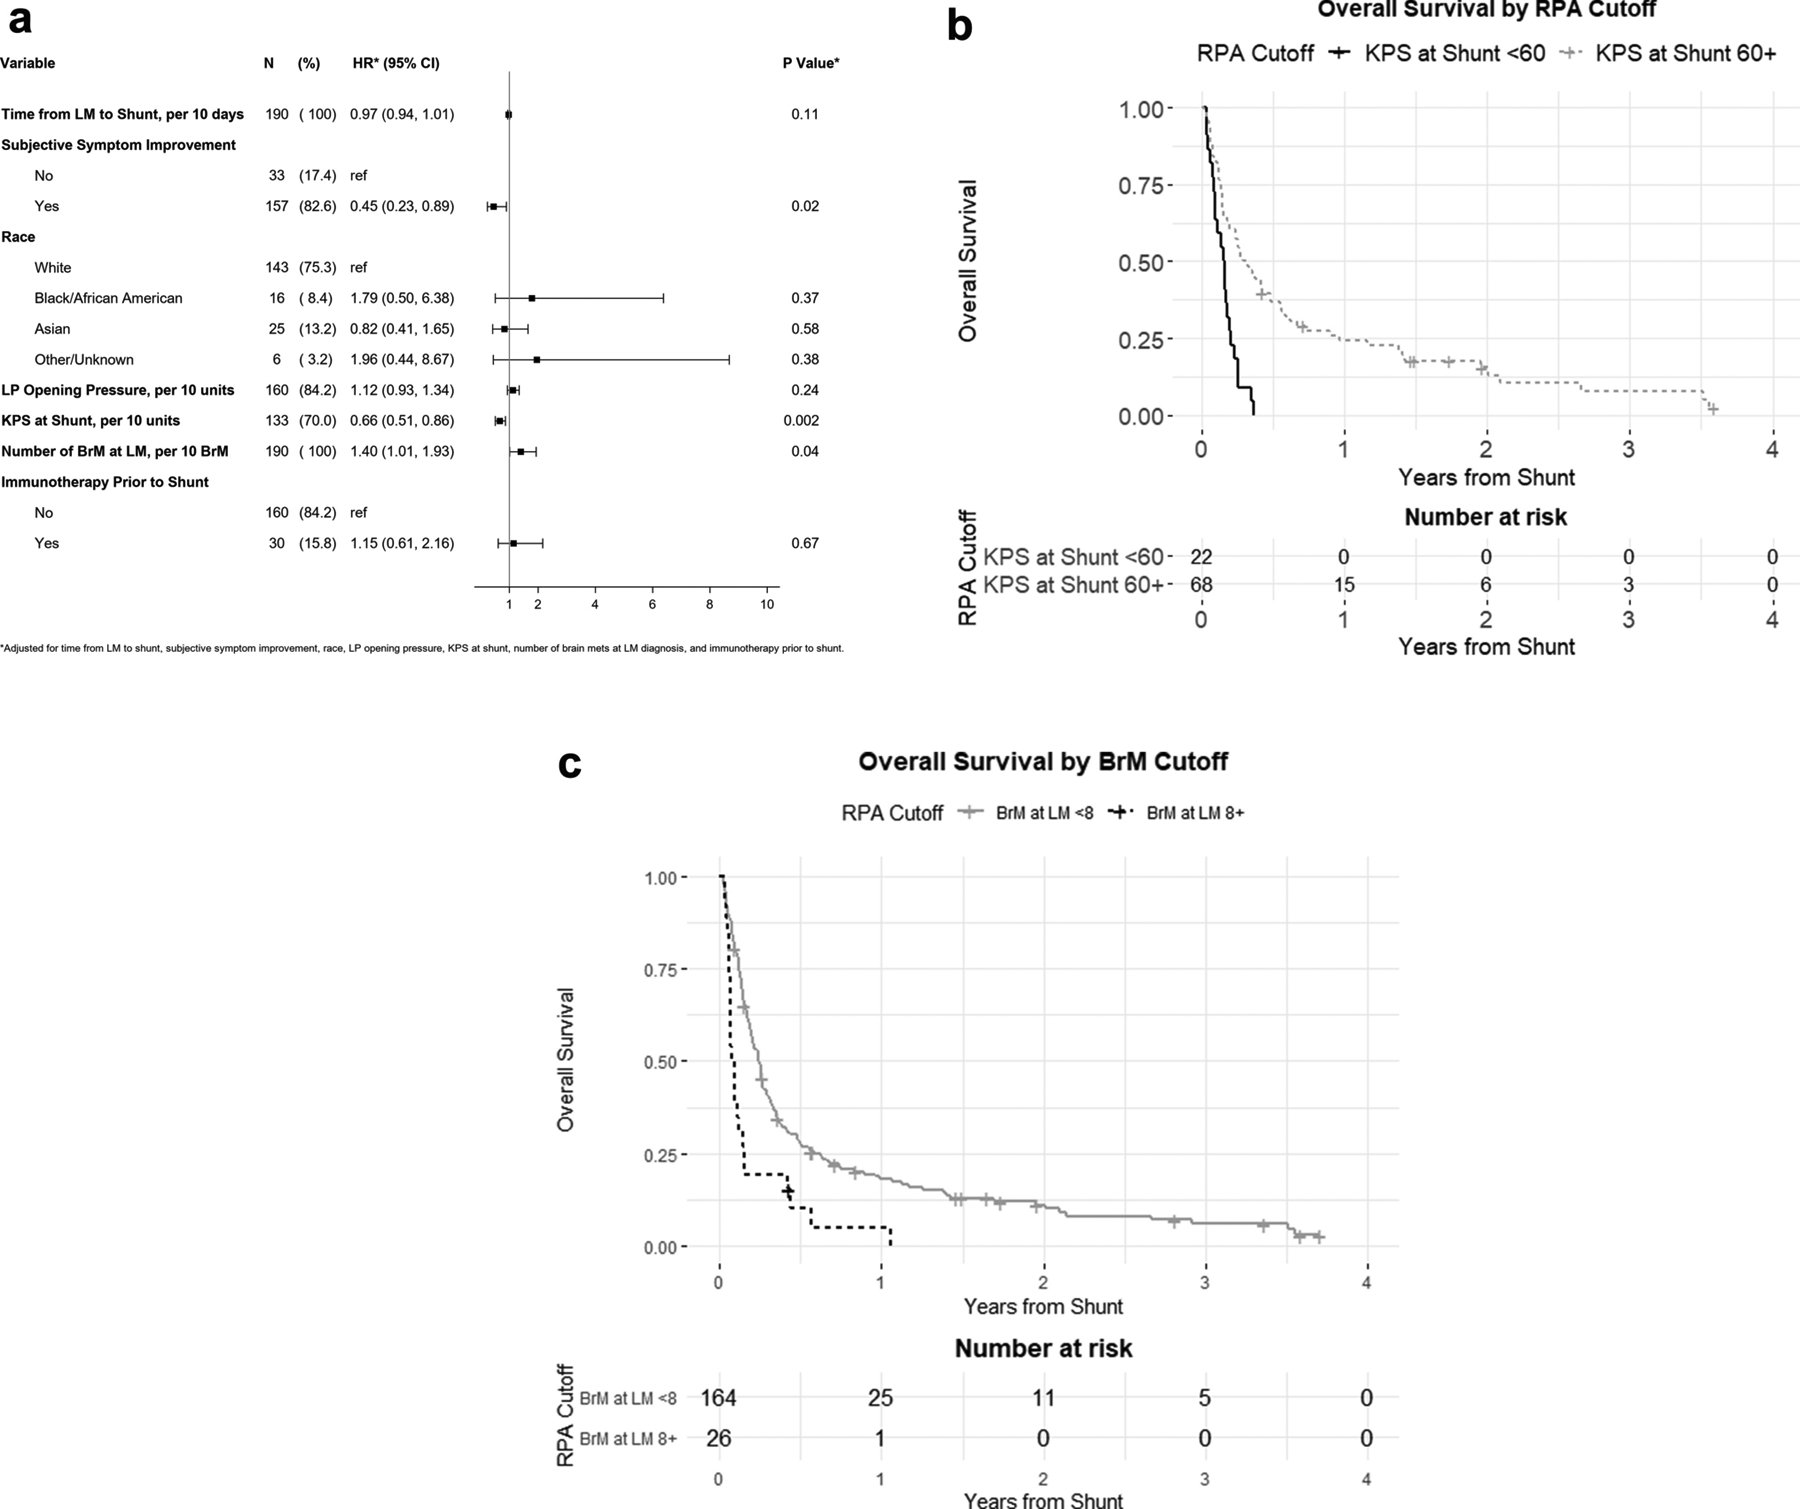
Figure 3.

Factors associated with prognosis after shunt placement. (A) Forest plot demonstrating hazard ratios from multivariable analysis of survival from time of shunt placement. (B) Kaplan-Meier curves demonstrating longer overall survival for patients with KPS of 60+ compared with KPS<60 at time of shunting and (C) <8 BrM versus 8+ BrM at LM diagnosis.
