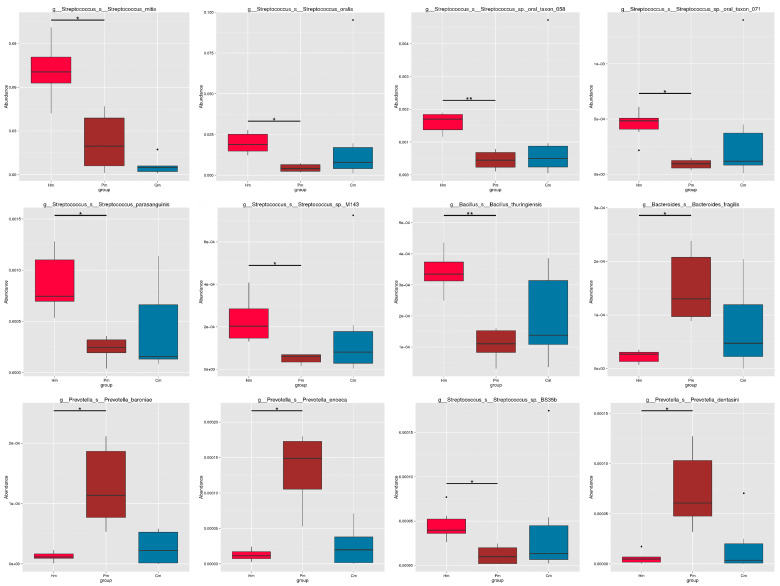
Figure 3.
Differences in the abundance of 12 genera among the Hm, Pm, and Cm groups. Metastats was used to test the differences in the microbial composition between groups, with q-values computed for the multiple comparisons. *q-value < 0.05; **q-value < 0.01. Hm, healthy individuals; Pm, patients with periodontitis alone; Cm, patients with Crohn’s disease and periodontitis.

