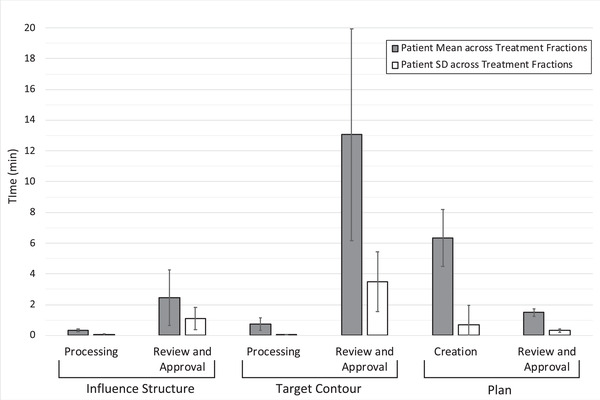
FIGURE 1.

Duration of the six phases of the online ART workflow for cervical cancer patients. The height of the grey bars depicts the population average of patient‐specific duration averages, representing the typical duration of each phase. The height of the white bars depicts the population average of patient‐specific duration standard deviations, representing typical variation across treatment fractions for an individual patient. Error bars represent ±1 standard deviation calculated across the population of patients, representing the interpatient variation of these measures
