
FIGURE 8.
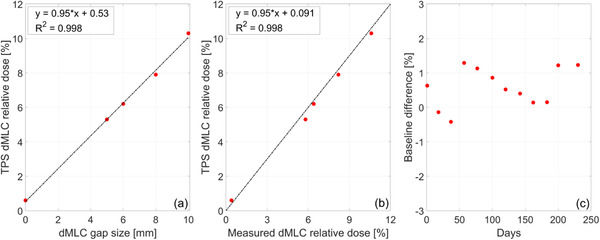
(a) Calculated dMLC relative dose (dMLC output/open field output) as a function of the nominal dMLC gap size. Dashed line shows least‐squares fit. (b) Calculated dMLC relative dose as a function of measured dMLC relative dose. Dashed line shows the identity line. (c) Longitudinal trend of baseline changes in dMLC relative dose for a nominal gap of 10 mm