. 2021 Jun 18;17(5):677–691. doi: 10.1039/d1mo00117e

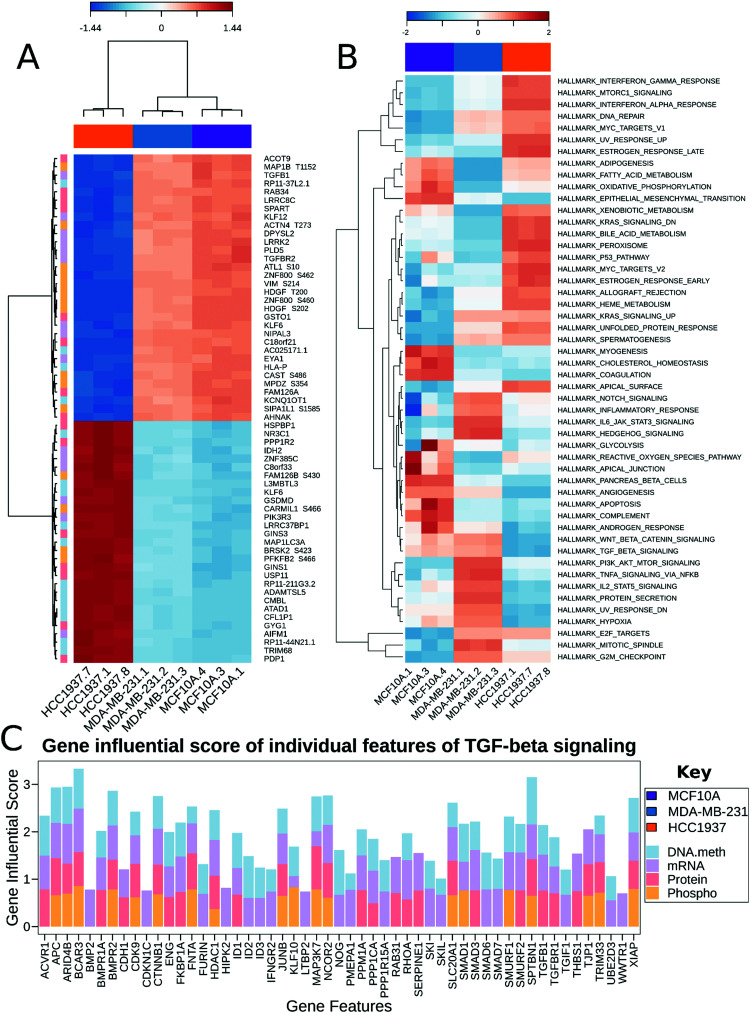
Fig. 4. Multi-omics data integration. (A) Clustered Image Map for component 1. Represents the multi-omics signature in relation with the samples. The most important features in component one distinguishing between the three cell lines is shown as a clustered heatmap using the cimDiablo() function provided by MixOmics. The red and blue colors represent positive and negative Pearson correlations respectively, whereas grey represents small correlation values. (B) MOGSA heatmap showing the Gene Set Score (GSS) for significantly regulated gene-sets in the cell lines. The white colored blocks indicate the change of gene-sets are non-significant (FDR corrected p-value > 0.01). (C) The Gene Influential Score of individual features for the TGFβ signaling pathway.

Fig. 4